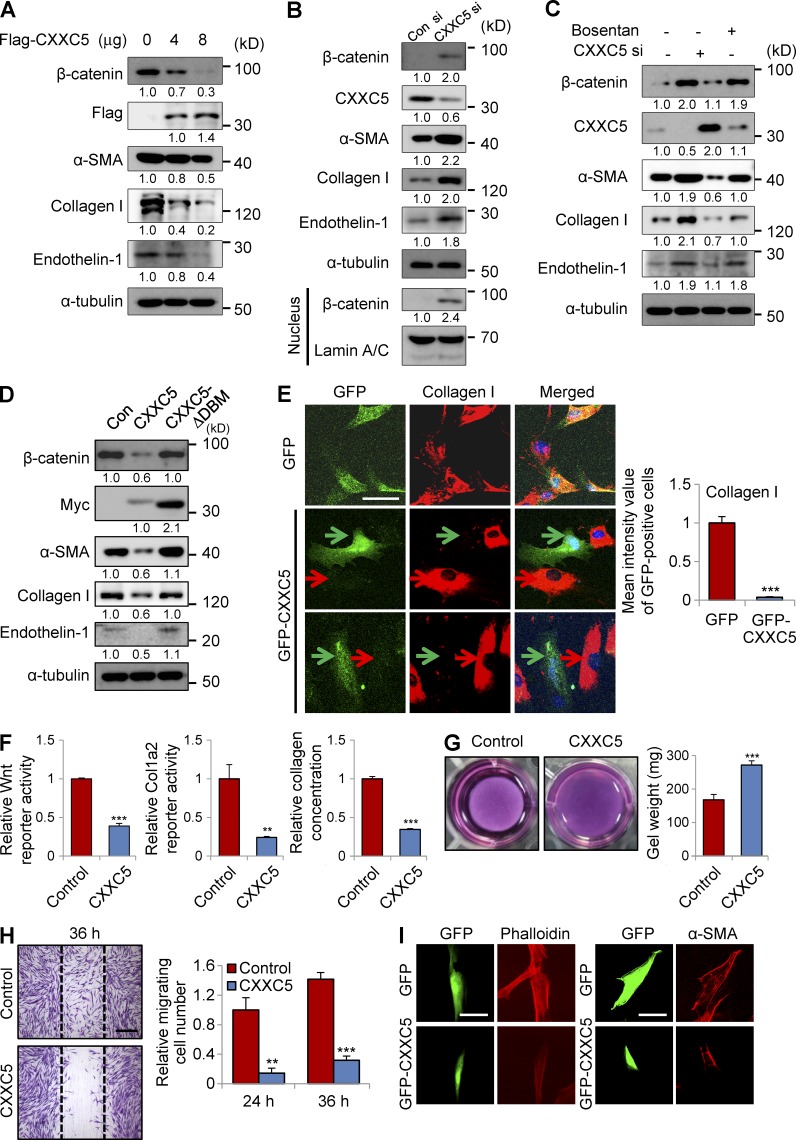
Figure 2.
CXXC5 attenuates myofibroblast differentiation and collagen production in human dermal fibroblasts. (A–D) Human dermal fibroblasts (n = 2–3 cells) were transfected with pcDNA3.0-CXXC5-Flag (A) at the indicated concentration, 100 nM CXXC5 siRNA (B and C), and pcDNA3.1-CXXC5-Myc and pcDNA3.1-CXXC5ΔDBM-Myc (D), together with corresponding control plasmid (Con) or control siRNA (Con si). The cells transfected with CXXC5 siRNA (C) or control siRNA were treated with or without 10 µM bosentan. The cells were further cultured for 2 d and harvested, and whole cell lysates (WCLs) were subjected to Western blot analyses to detect the protein levels of β-catenin, endothelin-1, α-SMA, and collagen I (n = 2 independent experiments). Relative densitometric ratios of each protein to loading control (α-tubulin or lamin A/C) are shown. (E) Human dermal fibroblasts were transfected with pEGFP-c3 or GFP-CXXC5 and further cultured for 2 d. The cells were immunocytochemically stained for collagen I. Representative confocal (ICC) images are shown (left), and mean intensity quantitation in GFP-positive cells was performed (right; ***, P < 0.0005; n = 3 independent experiments). Red arrows indicate the expression of collagen I, and green arrows indicate the expression of GFP. (F) Wnt luciferase reporter activity (left), Col1a2 luciferase reporter activity (middle), and collagen concentration (right) in the supernatant of human dermal fibroblasts were measured after transfection with pcDNA3.0 or pcDNA3.0-CXXC5-Flag (n = 3 independent experiments). Values are presented relative to control (**, P < 0.005; ***, P < 0.0005). (G) Contraction of collagen gels was monitored by measuring gel weight after transfection with pcDNA3.0-CXXC5-Flag (n = 3 independent experiments). Representative images (left) and quantitation (right) are shown (***, P < 0.0005). (H) The cells transfected with pcDNA3.0 or pcDNA3.0-CXXC5-Flag were scratched with sterile pipette tips and incubated in medium containing 5% serum for 36 h. Cells were then fixed with 4% PFA and stained with crystal violet. Representative microscopy images are shown (left), and cell migration was measured by counting migrating cells (right; **, P < 0.005; ***, P < 0.0005; n = 3 independent experiments). Dashed lines represent the widths of the initially scratched wounds. (I) ICC staining of human dermal fibroblasts transfected with GFP or GFP-CXXC5 was performed to detect phalloidin (left) and α-SMA (right). Representative ICC images are shown (n = 3 independent experiments). Means ± SD. Bars: (E and I) 50 µm; (H) 500 µm.

