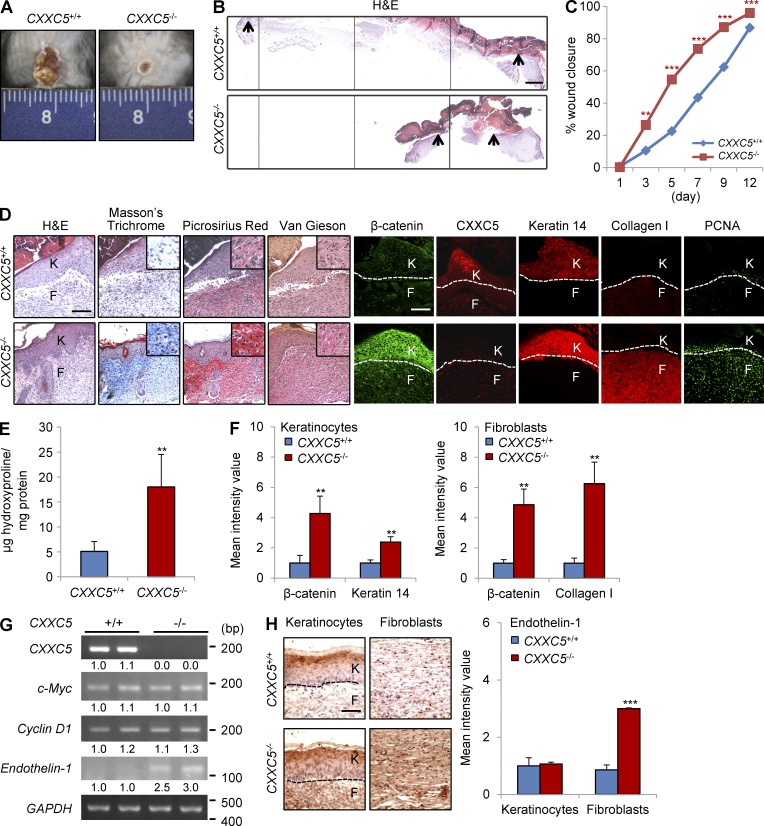
Figure 4.
Loss of CXXC5 accelerates cutaneous wound healing and enhances collagen production in mice. A full-thickness wound (diameter = 1.5 cm) was made on the backs of 7-wk-old CXXC5+/+ and CXXC5−/− mice (n = 16 mice/group). (A and B) Representative macroscopic images (A) and H&E staining (B) of wounded skin of CXXC5+/+ and CXXC5−/− mice at 12 d after wounding are shown (n = 3 independent experiments). Four continuously captured images were connected for analysis of the entire wound of CXXC5+/+ and CXXC5−/− mice. Arrowheads indicate the wound margins. (C) Relative healing of wounds of CXXC5+/+ and CXXC5−/− mice were measured at 1, 3, 5, 7, 9, and 12 d after wounding and shown as percent wound closure (**, P < 0.005; ***, P < 0.0005; n = 16 mice/group). (D) Representative images of H&E, Masson’s trichrome, picrosirius red, and van Gieson staining and IHC showing β-catenin, CXXC5, keratin 14, collagen I, and PCNA of wound sections from CXXC5+/+ and CXXC5−/− mice (n = 5 mice/group) are presented (n = 3 independent experiments). Insets represent the high magnification images of a region of interest. (E) Hydroxyproline levels in the wounds of CXXC5+/+ and CXXC5−/− mice were measured at 12 d after wounding (**, P < 0.005; n = 5 mice/group). (F) Quantitative TissueFAXS analyses of immunohistochemical staining for β-catenin, keratin 14, and collagen I were performed in keratinocytes (left) and fibroblasts (right) of wounds of CXXC5+/+ and CXXC5−/− mice (**, P < 0.005; n = 5 mice/group) at 12 d after wounding (n = 3 independent experiments). (G) RT-PCR analysis was performed with wound tissue obtained from CXXC5+/+ and CXXC5−/− mice at 12 d after wounding to detect mRNA levels of CXXC5, endothelin-1, c-Myc, cyclin D1, and GAPDH (n = 2 mice/group). Relative densitometry values are shown underneath blot as ratios relative to the levels of GAPDH. (H) IHC staining for endothelin-1 in keratinocytes (left) and fibroblasts (right) of wounds of CXXC5+/+ and CXXC5−/− mice (n = 3 mice/group; left) and quantitative TissueFAXS analyses of IHC staining for endothelin-1 (right) were performed (***, P < 0.0005; n = 3 independent experiments). (D and H) Dashed lines demarcate the epidermal–dermal boundary. F, fibroblasts; K, keratinocytes. Bars: (B) 500 µm; (D) 100 µm; (H) 50 µm. Means ± SD.

