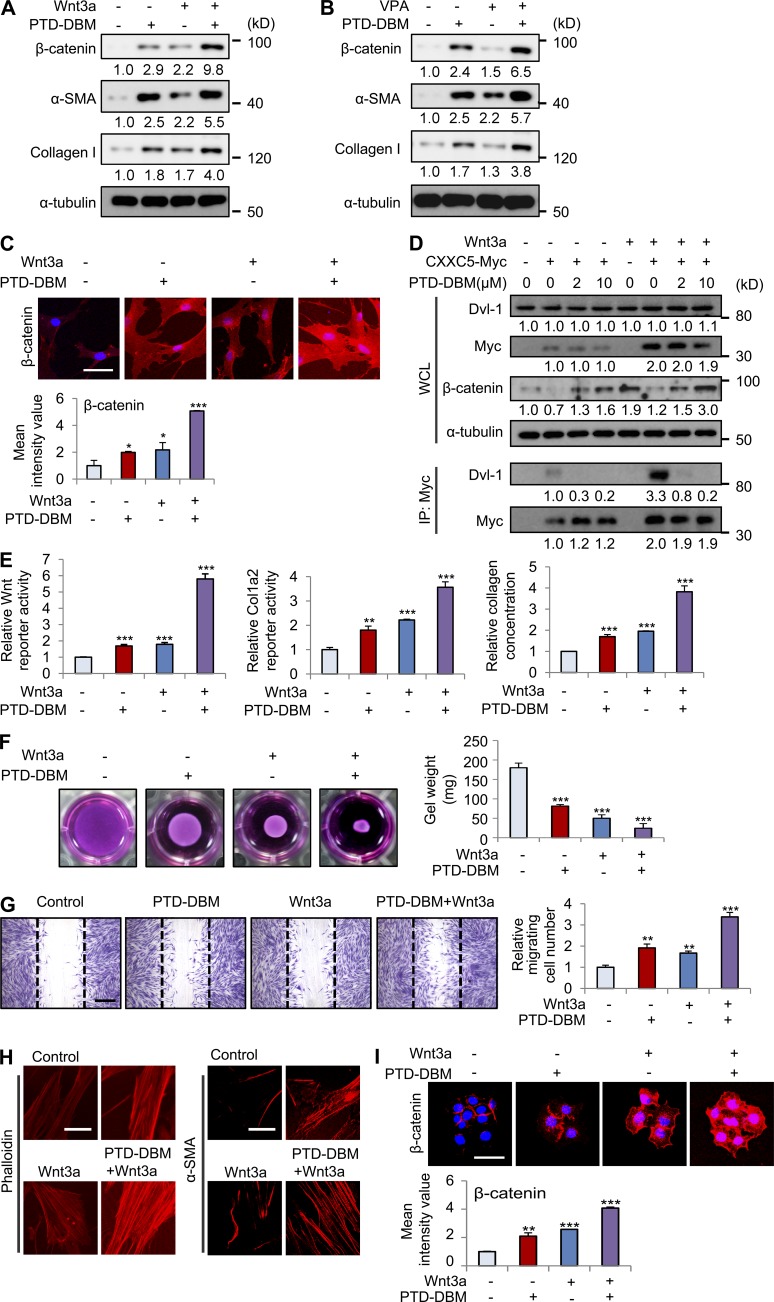
Figure 8.
Combination treatment with PTD-DBM and Wnt3a synergistically induces collagen production in human dermal fibroblasts. (A) Human dermal fibroblasts (n = 2–3 cells) were treated with 2 µM PTD-DBM and/or 50 ng/ml Wnt3a for 2 d. (B) Human dermal fibroblasts were treated with 2 µM PTD-DBM and/or 1 mM VPA for 2 d. (A and B) WCLs were subjected to Western blotting to detect β-catenin, α-SMA, collagen I, and α-tubulin (n = 2 independent experiments). Relative densitometric ratios of each protein to α-tubulin are shown. (C) Representative images of ICC staining of β-catenin (top) in human dermal fibroblasts, which were treated with 2 µM PTD-DBM and/or 50 ng/ml Wnt3a, and mean intensity value (bottom) are shown (*, P < 0.005; ***, P < 0.0005; n = 3 independent experiments). (D) Human dermal fibroblasts were treated with 2 µM PTD-DBM and/or 50 ng/ml Wnt3a after transfection with pcDNA3.1 or pcDNA3.1-CXXC5-Myc. The cell lysates were used for immunoprecipitation with anti-Myc antibody (n = 2 independent experiments). Relative densitometry values are shown below the blots. (E) Wnt reporter assay, Col1a2 reporter assay, and Sircol collagen assay in human dermal fibroblasts treated with PTD-DBM and/or Wnt3a were measured (**, P < 0.005; ***, P < 0.0005; n = 3 independent experiments). (F) A collagen gel contraction assay in human dermal fibroblasts treated with PTD-DBM and/or Wnt3a was performed, and representative images are shown (left). Gel weight quantitation is also shown (right; ***, P < 0.0005; n = 3 independent experiments). (G) An in vitro wound healing assay in human dermal fibroblasts treated with PTD-DBM and/or Wnt3a was performed. Representative images (left) and migrating cell numbers (right) are shown (**, P < 0.005; ***, P < 0.0005; n = 3 independent experiments). The widths of the initially scratched wounds are indicated with dashed lines. (H) ICC staining of human dermal fibroblasts treated with PTD-DBM and/or Wnt3a was performed to detect phalloidin (left) and α-SMA (right; n = 3 independent experiments). (I) Representative images of ICC staining of β-catenin (top) are shown in HaCaT keratinocytes, which were treated with 2 µM PTD-DBM and/or 50 ng/ml Wnt3a. Mean intensity values are shown below (**, P < 0.005; ***, P < 0.0005; n = 3 independent experiments). Bars: (C, H, and I) 50 µm; (G) 500 µm. Means ± SD.

