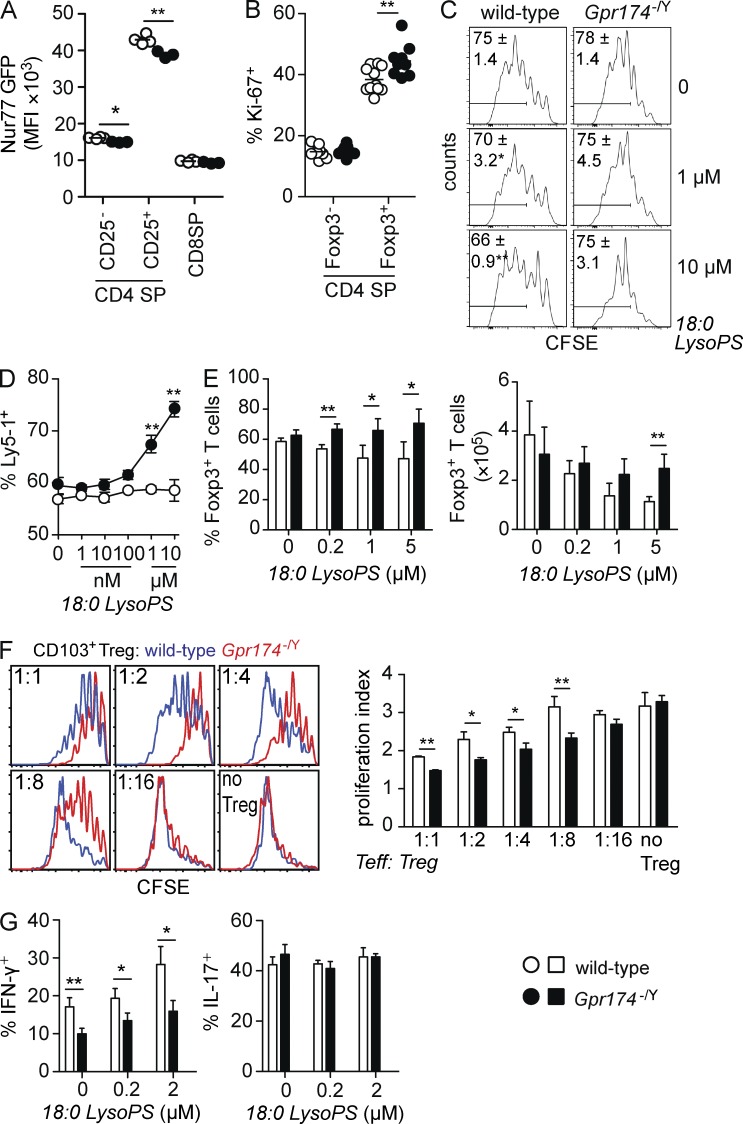
Figure 3.
CD4+ T cells show diminished Nur77 levels and enhanced proliferation in Gpr174−/Y mice. (A) Flow cytometry analysis of the mean fluorescence intensity (MFI) of Nur77-GFP expression in thymocytes from 6-wk-old wild-type and Gpr174−/Y Nur77-GFP+ littermate male mice. Each dot represents an individual mouse; n = 4. (B) Intracellular levels of Ki-67 expression in the indicated thymocyte populations from 6-wk-old wild-type and Gpr174−/Y littermate male mice were determined using flow cytometry. The percentage of Ki-67+ cells among Foxp3+ T reg and Foxp3− CD4 SP thymocytes is shown; n = 9 or 10. (A and B) Horizontal lines indicate the mean. (C) The effects of LysoPS on T cell proliferation under neutral conditions. CFSE-labeled LN cells from wild-type or Gpr174−/Y mice were cultured in round-bottom plates with 0.25 µg/ml soluble anti-CD3 and the indicated amounts of LysoPS. Cell proliferation was assessed 3 d later based on CFSE dilution that was measured by flow cytometry; live CD4+TCR-β+ T cells are shown. Gates indicate the percentage of cells that divided at least three times, and means ± SD are shown; n = 4. (D and E) Direct effects of GPR174 and its ligand LysoPS on proliferation and Foxp3 induction. In flat 96-well plates coated with anti-CD3 and anti-CD28 mAbs (both 2 µg/ml), a mixture of either wild-type (Ly5-1+) or Gpr174−/Y (Ly5-1+) with congenic wild-type (Ly5-2+) naive CD4+ T cells (D) or either wild-type or Gpr174−/Y naive CD4+ T cells (E) were added. Cells were cultured in the presence of 200 U/ml IL-2 (D) or 1 ng/ml TGF-β (E) and the indicated concentrations of 18:0 LysoPS for 4 d. Expression of Ly5-1 and Ly5-2 (D) or Foxp3 (E) was measured by flow cytometry; n = 4; error bars indicate SD. Counts were quantified based on the number of events acquired on a flow cytometer run for 60 s per sample (E). Cells used in E were isolated from mixed bone marrow chimeric mice to minimize extrinsic effects on naive T cells. (F) In an in vitro T reg cell suppressor assay, CD4+CD25+CD45RBhighCD103− T reg cells were sorted from spleens of wild-type and Gpr174−/Y littermate mice. T reg cells were cultured at the indicated ratios with 105 CFSE-labeled naive CD45.1+CD4+ T cells and 2 × 10⁴ CD11c-enriched DCs in the presence of 0.5 µg/ml soluble anti-CD3ε mAb for 3 d. The proliferation index of CFSE-labeled cells was determined in triplicate cultures, and representative CFSE flow cytometry plots are shown. (G) A total of 2 × 10⁵ naive CD4+ T cells from CD45.2+ wild-type or Gpr174−/Y littermate mice were cultured along with an equivalent number of cells from CD45.1+ wild-type mice under Th1 or Th17 polarizing conditions for 5 d. After restimulation with PMA and ionomycin, the percentage of CD45.2+ cells that secreted IFN-γ or IL-17 was determined by intracellular cytokine staining and flow cytometry analysis. (F and G) Error bars show SD. Data were evaluated by unpaired Student’s t test: *, P < 0.05; **, P < 0.01. All data are representative of three or more independent experiments.

