Figure 1.
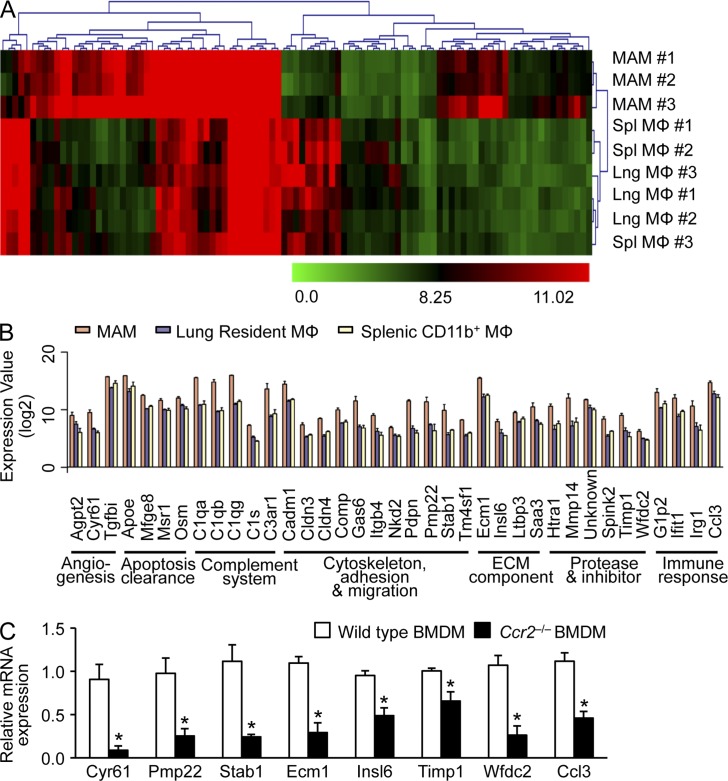
Identification of MAM-specific genes regulated by CCR2 signaling in mice. (A) Heat maps of unsupervised hierarchical clustering of microarray analysis of RNA isolated from MAMs (F4/80+CD11b+) compared with those from resident lung macrophages (Lng; F4/80+CD11c+) and splenic macrophages (Spl; F4/80+CD11b+). MAMs were isolated from mice injected with Met-1 mouse breast cancer cells (n = 3/group). Color bars show intensity of gene expression. (B) Genes differentially regulated in MAMs (more than threefold change; P < 0.01, ANOVA) were clustered according to GO terms. Data on expression values are presented as means ± SEM. Note that the scale is exponential. (A and B) data were derived from three independent repeats for each sample group. (C) The relative mRNA expression of candidate genes (as indicated) was assessed by RT-PCR in BMDMs isolated from WT or Ccr2−/− mice (n = 3, three independent experiments). Data are means ± SEM. *, P < 0.05.

