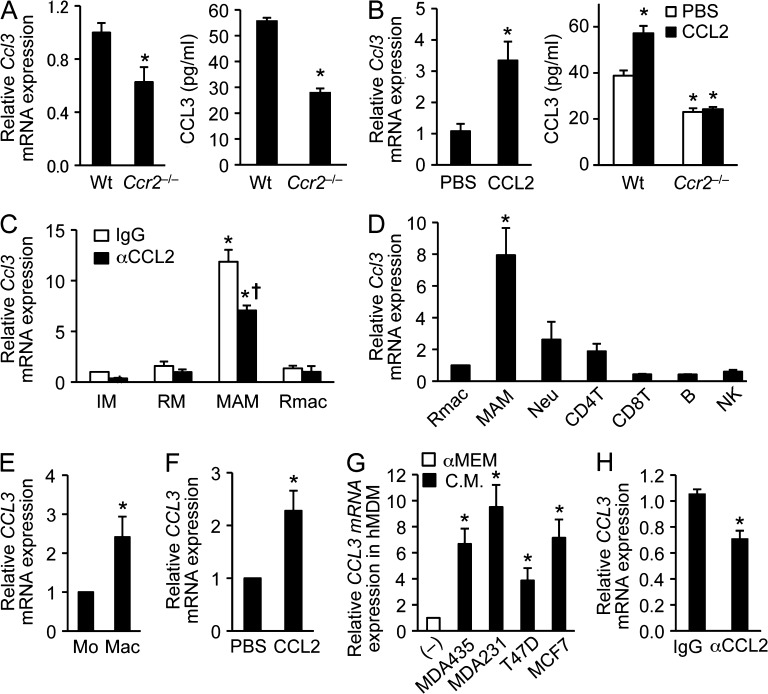
Figure 2.
CCR2 signaling regulates CCL3 expression in MAMs. (A) Levels of Ccl3 mRNA (left) and CCL3 protein (right) in BMDMs isolated from WT or Ccr2−/− mice were assessed by RT-PCR (n = 6 per genotype, 6 independent experiments) and ELISA (n = 3 per genotype, two independent experiments). Data are means ± SEM. *, P < 0.01 versus WT. (B) Ccl3 mRNA (left) and CCL3 protein (right) were assessed by RT-PCR (n = 3, 2 independent experiments) and ELISA (n = 3 per genotype, 2 independent experiments) in macrophages cultured with PBS or recombinant CCL2 (100 ng/ml). The BMDMs were isolated from WT or Ccr2−/− mice. Data are means ± SEM. *, P < 0.01. (C) Expression of Ccl3 mRNA was assessed by RT-PCR (n = 4, four independent experiments) in monocytes and macrophages obtained from E0771-LG tumor-injected mice treated with neutralizing anti-CCL2 or control IgG antibodies. IM, inflammatory monocytes (CD115+CD11b+Ly6C+); RM, resident monocytes (CD115+CD11b+Ly6C–); MAMs (F4/80+CD11b+CD11c–Ly6C–); Rmac, resident macrophages (F4/80+CD11b–CD11c+Ly6C–). Data are means ± SEM. *, P < 0.01 versus IgG-IM; †, P < 0.05 versus IgG-MAM. Gating strategies are shown Fig. S1. (D) Expression of Ccl3 mRNA was assessed by RT-PCR in Rmac, MAM (n = 7, 7 independent experiments) or neutrophil (Neu), CD4+ T cell, CD8+ T cell, B cell, and NK cell (n = 3, 3 independent experiments). The leukocytes were isolated from tumor-bearing mouse lung. Data are means ± SEM. *, P < 0.01 versus Rmac. (E) Relative CCL3 mRNA expression was assessed by RT-PCR (n = 4, 4 independent experiments) in human monocytes (Mo) and those differentiated into macrophages by CSF-1 (Mac). Data are means ± SEM. *, P < 0.05. (F) Relative CCL3 mRNA level was assessed by RT-PCR (n = 4, 4 independent experiments) in human macrophages cultured with recombinant human CCL2 (100 ng/ml). Data are means ± SEM. *, P < 0.05. (G) Expression of CCL3 mRNA was assessed by RT-PCR in human MDMs (hMDM) cultured with conditioned medium (C.M.) from human cancer cell lines as indicated. As a control (–), the cells were cultured in nonconditioned medium (αMEM including 10% FBS and 103 U/ml CSF-1). n = 5, 5 independent experiments. Data are means ± SEM. *, P < 0.01. (H) Expression of CCL3 mRNA was assessed by RT-PCR in human macrophages cultured in MDA231 conditioned medium with neutralizing anti-CCL2 or control IgG antibodies. n = 3. Data are means ± SEM. *, P < 0.05.

