Figure 7.
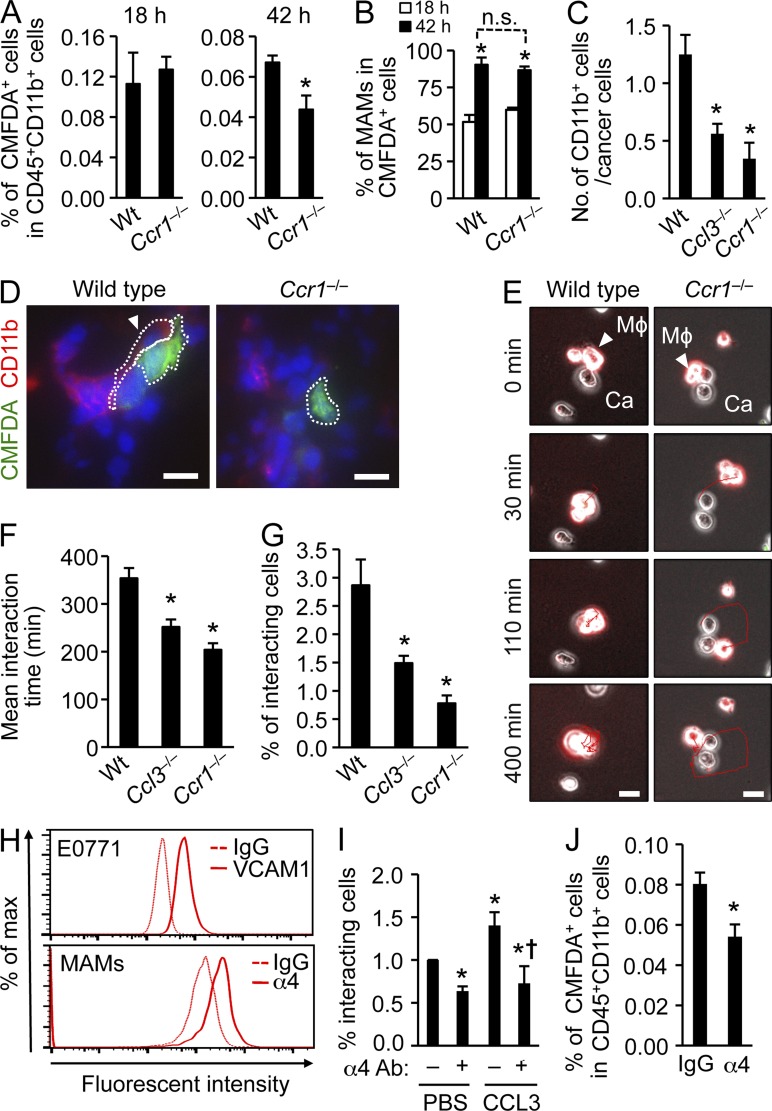
CCR1 signaling enhances attachment of macrophages to cancer cells and promotes their retention in tumor-bearing lung. (A) The fate of transferred CMFDA-labeled IMs in mouse lung metastases were followed. CD11b+CD115+Ly6C+ inflammatory monocytes (IMs) isolated from WT or Ccr1−/− mice were labeled with CMFDA and transferred to WT mice that received i.v. injection of E0771-LG cells expressing luciferase. Pulmonary tumor burdens in the recipients were determined by in vivo bioluminescence imaging 1 d before monocyte transfer (10 d after tumor injection). Relative numbers of CMFDA-labeled cells in CD45+CD11b+ cells from tumor bearing lungs were assessed 18 or 42 h after IM transfer (n = 4, 4 independent experiments). Data are means ± SEM. *, P < 0.01. (B) Data show percentage of F4/80+CD11b+Ly6C− cells (MAMs) in CMFDA+ cells from tumor bearing lung (n = 4, 4 independent experiments). Data are means ± SEM. *, P < 0.01 versus 18 h. n.s., not significant. (C) Number of CD11b+ cells associated with cancer cells in the lung were counted in WT Ccl3−/−, and Ccr1−/− mice from images in D (n = 4, 4 independent experiments). Interaction between cancer cells and CD11b+ myeloid cells were detected by immunostaining 24 h after intravenous injection of CMFDA-labeled E0771-LG cells. Data are means ± SEM. *, P < 0.05. (D) Representative fluorescence microscopy images of lung 24 h after E0771-LG injection. Green, CMFDA-labeled E0771-LG cells; Red, CD11b; Blue, nuclei; Arrow head, interaction between myeloid cells and cancer cells. Dotted line indicates the interaction between macrophage and tumor cell. Bars, 10 µm. (E) Interactions between macrophages and cancer cells (n = 3, 3 independent experiments) were assessed by time-lapse imaging. Representative microscopy images over a 400-min time course are shown. The time when the target macrophage attached to cancer cells was designated as 0 min. Arrow head, the target macrophage (Mϕ) attached to the cancer cell (Ca); Red line, track of macrophage. Bars, 10 µm. See Videos 1 and 2. (F) Mean duration of interactions between macrophages and cancer cells (n = 3, three independent experiments) were assessed from images in (E; 10 fields/group in each experiment). Data are means ± SEM. *, P < 0.01. (G) Interactions between macrophages and cancer cells were assessed by flow cytometry (n = 4, 4 independent experiments). BMDMs from C57BL/6, Ccl3−/−, and Ccr1−/− mice were labeled with CMTMR and mixed with CMFDA-labeled E0771-LG cells. Data are represented as the ratio of CMFTMR/CMFDA double-positive population. Data are means ± SEM. *, P < 0.05. (H) Surface levels of VCAM-1 on E0771-LG tumor cells and integrin α4 on MAMs isolated from lungs 24 h after tumor injection were assessed by flow cytometry. Representative results from two independent experiments (n = 2) are shown. (I) Interactions between macrophages and cancer cells in the presence of recombinant CCL3 or PBS were assessed by flow cytometry (n = 4, four independent experiments). Macrophages were pretreated with anti-integrin α4 neutralizing antibody (α4 Ab: +) or control isotype matched IgG (α4 Ab: –). Data are means ± SEM. *, P < 0.01 versus PBS; †, P < 0.05 versus CCL3. (J) The effect of integrin α4 inhibition on the fate of transferred IMs in mouse lung metastases was assessed by flow cytometry following the experimental procedure in A. Anti-integrin α4 neutralizing antibody (α4) was injected 18 h after IM transfer. Relative numbers of CMFDA-labeled cells in CD45+CD11b+ cells from tumor bearing lung were assessed 42 h after IM transfer (n = 5, five independent experiments). Data are means ± SEM. *, P < 0.05.

