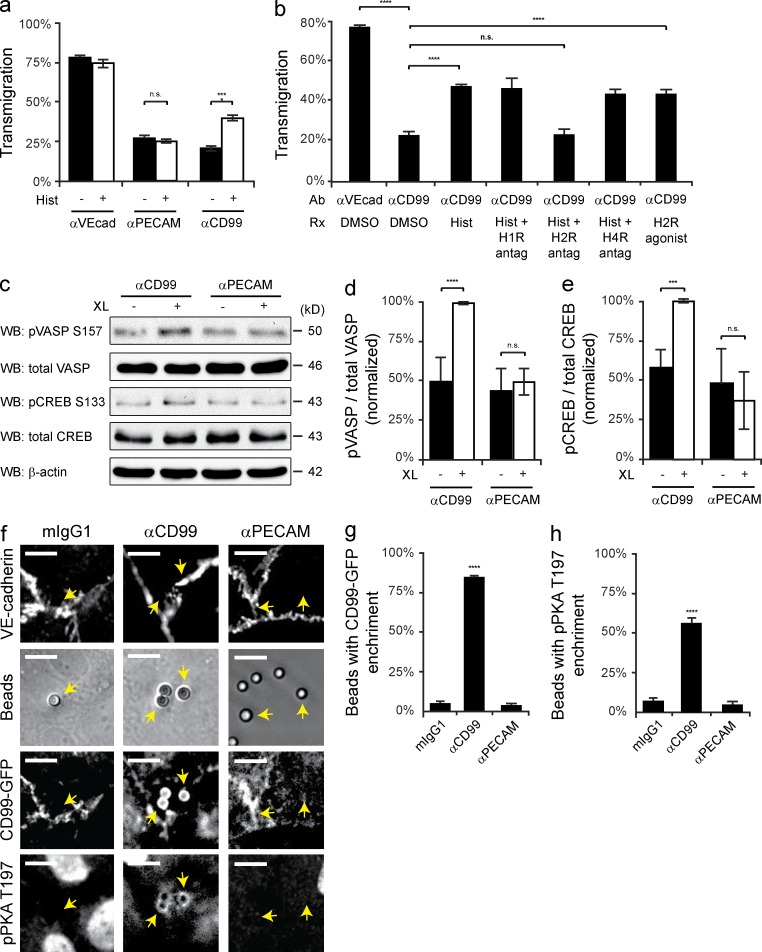
Figure 2.
Engagement of EC CD99 activates PKA. (a) Quantitative TEM assays were performed using HUVECs pretreated with nonblocking anti–VE-cadherin, anti-PECAM, or anti-CD99 mAb. After 50 min, histamine (10 µM) was added to samples for 10 min at 37°C. (b) TEM assays were performed using HUVECs pretreated with either anti–VE-cadherin (nonblocking control) or anti-CD99 mAb. Additionally, HUVECs were pretreated with diphenhydramine (H1-R antagonist, 10 µM), ranitidine (H2-R antagonist, 10 µM), or JNJ-10191584 (H4-R antagonist, 10 µM) or DMSO (carrier). After 50 min, histamine (10 µM) or dimaprit (H2-R agonist, 10 µM) was added to samples for 10 min. (c) Immunoblot analysis of phospho-VASP S157 and phospho-CREB S133 activity after anti-CD99 or anti-PECAM mAb (control) cross-linking (XL) in resting HUVECs. (d and e) Quantification of results in c, pVASP and pCREB signals were normalized to total VASP and total CREB, respectively. Values were then normalized to CD99 XL. (f) Antibody-coated polystyrene bead recruitment of CD99 and activation of phospho-PKA. Beads precoupled with mIgG1, anti-CD99 mAb, or anti-PECAM mAb were added to HUVEC monolayers expressing hCD99-GFP. Monolayers were subsequently stained with anti–VE-cadherin and anti-pPKA T197 PKA antibodies. Arrows indicate beads bound to HUVECs. (g and h) Quantification of data; percent of beads in the field of view with either hCD99-GFP or pPKA T197 enrichment. Bars, 10 µm. Images are representative of three (f) or four (c) independent experiments. Numerical values are the mean of three (a, b, e, g, and h) or four (d) independent experiments. Error bars represent SD (d and e) or SEM (a, b, g, and h; ***, P < 0.001; ****, P < 0.0001; Student’s t test [a, b, d, and e] and ANOVA [g and h]).

