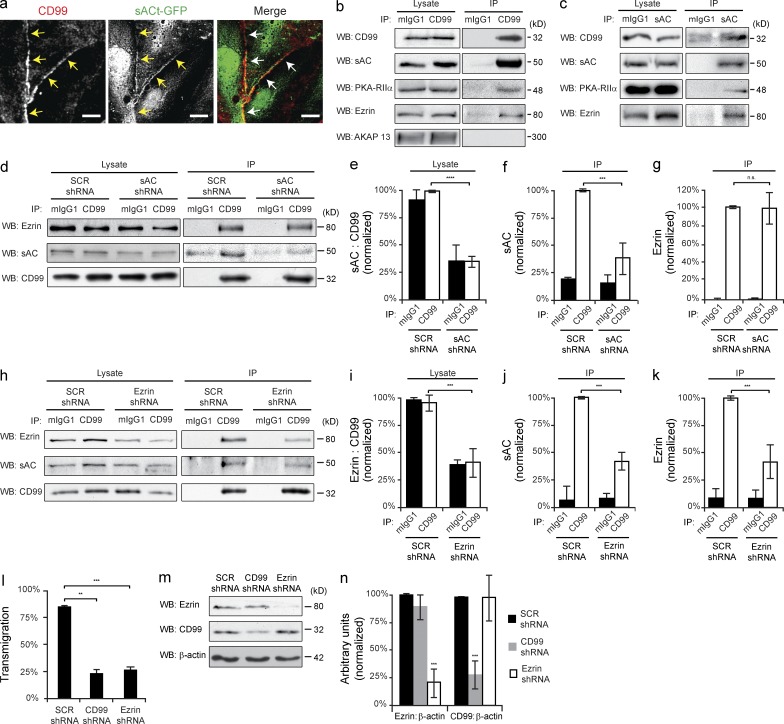
Figure 7.
CD99, sAC, PKA, and ezrin form a signaling complex to regulate transmigration. (a) HUVECs were infected with sACt-GFP encoding adenovirus. Cells were then fixed and stained for CD99. Arrows denote junctional localization. (b and c) CD99 and sAC were immunoprecipitated from HUVEC whole-cell lysate. Immunoblot analysis was performed for CD99, sAC, PKA-RIIα, ezrin, and AKAP-13. Cell lysates were probed in parallel for loading controls. (d) Endogenous CD99 was immunoprecipitated from iHUVECs expressing either SCR or sAC shRNA. Immunoblot analysis was performed for ezrin, sAC, and CD99 for both cell lysates and immunoprecipitation samples. (e) Quantification of lysates. Efficacy of sAC knockdown was quantified by normalizing sAC expression to CD99. Values were then normalized to the SCR shRNA/CD99 IP condition. (f and g) Quantification of coimmunoprecipitation samples. The amount of sAC (f) and ezrin (g) that coimmunoprecipitated with CD99 was calculated and normalized to the SCR shRNA CD99 IP condition. (h) Endogenous CD99 was immunoprecipitated from iHUVECs expressing either SCR or ezrin shRNA. Immunoblot analysis was performed for ezrin, sAC, and CD99 for both cell lysates and immunoprecipitation samples. (i) Quantification of lysates. Efficacy of ezrin knockdown was quantified by normalizing ezrin expression to CD99. Values were then normalized to the SCR shRNA CD99 IP condition. (j and k) Quantification of coimmunoprecipitations. The amount of sAC (j) and ezrin (k) that coimmunoprecipitated with CD99 was calculated and normalized to the SCR shRNA CD99 IP condition. (l) Quantitative TEM assays were performed using HUVECs pretreated with CD99, ezrin, or SCR shRNA. (m) HUVECs were treated in parallel and used for immunoblot analysis of ezrin, CD99, and β-actin. (n) Quantification of results above. Ezrin and CD99 expression was normalized to β-actin for each condition. Values were then normalized to SCR shRNA conditions. Bars, 10 µm. Images are representative of three (a–d, h, and m) independent experiments. Numerical values are the mean of three (e–g, i–l, and n) independent experiments. Error bars represent SD **, P < 0.01; ***, P < 0.001; ****, P < 0.0001; Student’s t test [e–g and i–l] and ANOVA [n]).

