Figure 9.
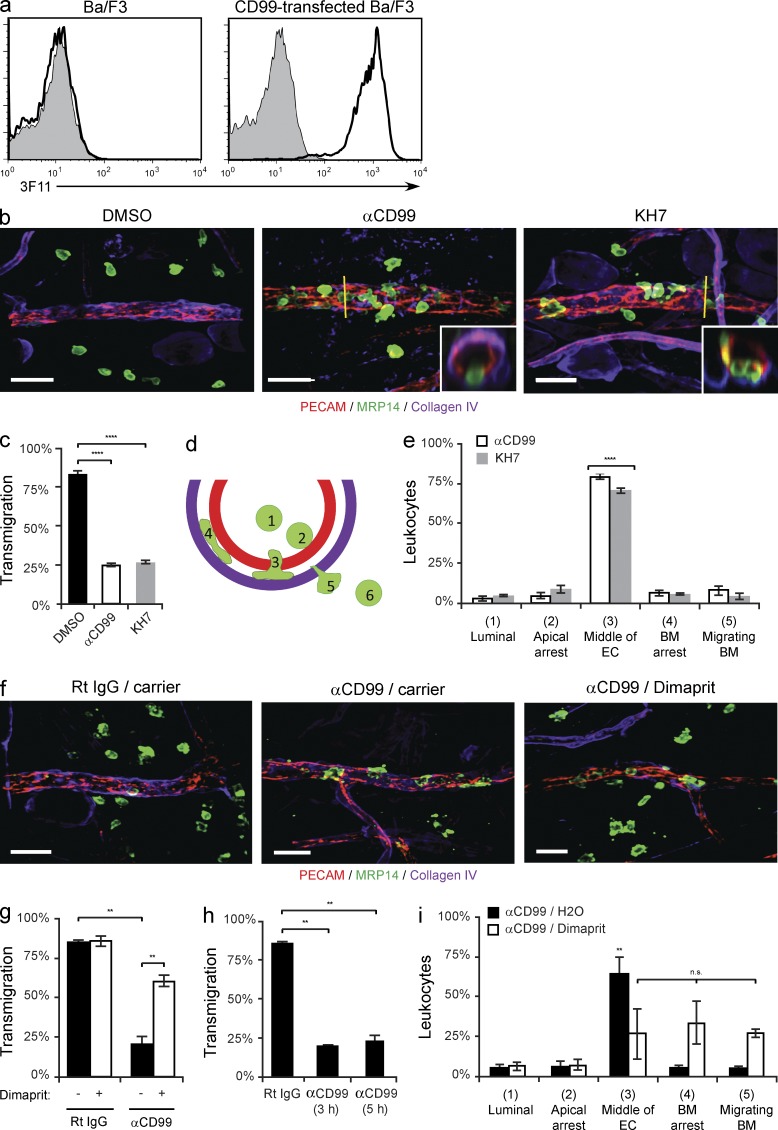
SAC is critical for leukocyte transmigration in vivo. (a) Validation of rat anti–mouse CD99 monoclonal antibody, clone 3F11. Flow cytometry analysis of control (shaded) or anti–mouse CD99 (3F11, thick line) mAb binding to parental or mouse CD99-transfected Ba/F3 cells. (b) The ears of wild-type FVB/n mice (age and sex matched littermates) pretreated with DMSO, anti-CD99 (3F11 mAb), or KH7 (5 µmol/kg) were stimulated with croton oil (1%, 20 µl/ear) or carrier (10% olive oil/90% acetone). After 5 h, mice were sacrificed, their ears were harvested, and immunohistochemical staining was performed using anti-PECAM (ECs), anti-MRP14 (neutrophils), and anti–collagen-IV (basement membrane). 3D confocal images were acquired for each sample. (c) Quantification of results above. Percent of leukocytes extravasated within 50 µm of venules per field of view. (d) Model for quantification of site of arrest. Neutrophils were scored as being in one of six positions: luminal (1), apically arrested (2), arrested partway through the endothelium (3), arrested on the basement membrane (4), migrating through the basement membrane (5), or fully extravasated (6). (e) Quantification of the site of arrest for anti-CD99 and KH7-treated animals. (f) The ears of wild-type FVB/n mice (age- and sex-matched littermates) pretreated with anti-CD99 or rat IgG (control) were stimulated with croton oil. After 3 h, mice received dimaprit (10 mg drug/kg animal) or carrier (H2O). Mice were sacrificed 2 h later, their tissue stained, and analyzed as described in panel b. (g) Quantification of results. Percent of leukocytes extravasated within 50 µm of venules per field of view. (h) Additional mice pretreated with anti-CD99 mAb were sacrificed at the time dimaprit was given (3 h) to ensure that the anti-CD99 blockade was present throughout the experiments (5 h total). (i) Quantification of the site of arrest for anti-CD99/carrier and anti-CD99/dimaprit-treated animals. 100–200 cells were analyzed per ear. Total PMN per field of view, vessel length, and vessel diameter were equivalent for all conditions tested (not depicted). Images were acquired with a 40× objective (n = 1.00). Insets show xz-orthogonal view (where yellow bar dissects the vessel) to demonstrate site of neutrophil arrest. Bars, 25 µm. Two to three mice per condition were used for each experiment. Images are representative of two (f) or three (a and b) independent experiments. Data represent the average value of two (g-i) or three (c and e) independent experiments. Error bars denote SEM ***, P < 0.001; ****, P < 0.0001; Student’s t test [c and g] and ANOVA [e and i]).

