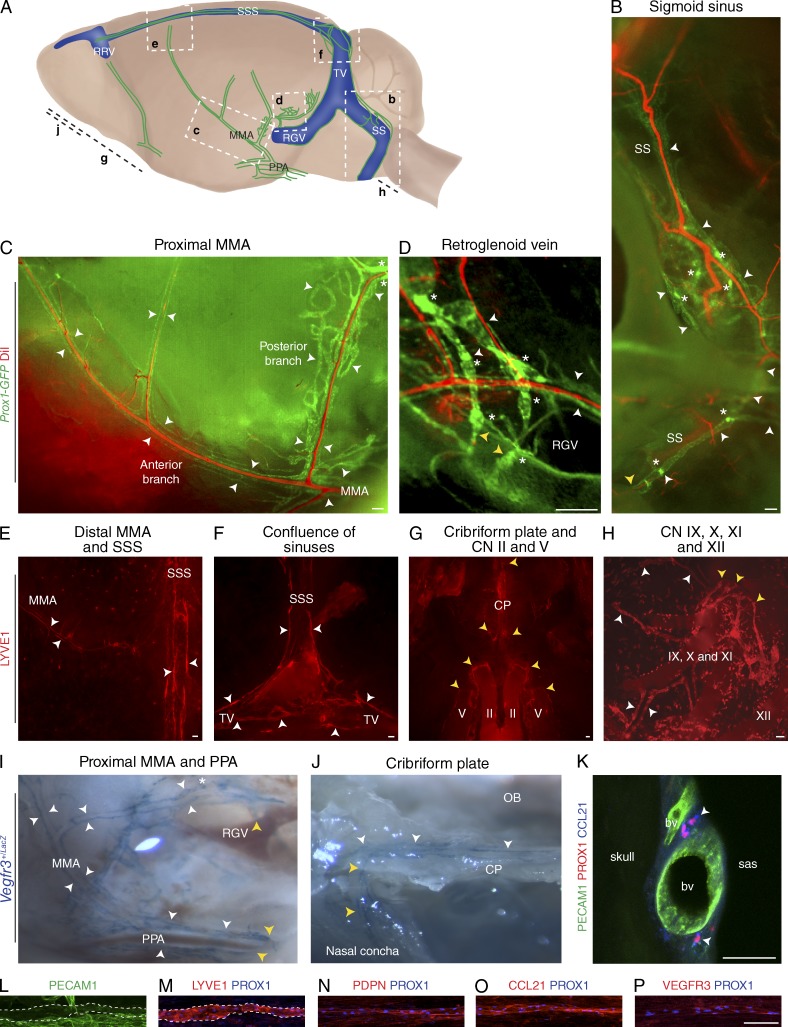
Figure 1.
Terminally differentiated lymphatic vessels in the dura mater of the brain. Visualization of CNS lymphatic vasculature using Prox1-GFP reporter mice with DiI counterstaining for blood vasculature, Vegfr3+/LacZ reporter mice and immunofluorescence for PECAM1, and the lymphatic markers PROX1, LYVE1, PDPN, CCL21, and VEGFR3, as indicated. White arrowheads denote lymphatic vessels, yellow arrowheads denote the skull exit sites, and asterisks denote valves. (A) A schematic image of the various areas analyzed. The letters in bold refer to the corresponding images below. MMA, middle meningeal artery; PPA, pterygopalatine artery; RGV, retroglenoid vein; RRV, rostral rhinal vein; SS, sigmoid sinus; SSS, superior sagittal sinus; TV, transverse vein. (B) Lymphatic vessels running down along the SS and exiting the skull. (C) Lymphatic vessels running down along the proximal MMA branches. (D) Lymphatic vessels around the RGV with some vessels exiting the skull. (E–H) Whole-mount LYVE1 immunofluorescence of the skull top and base. (E) Lymphatic vessels along the SSS and the distal parts of the anterior MMA branch extending toward the bregma. (F) Lymphatic vessels along the SSS, bifurcating into the TVs at the confluence of sinuses. (G) Lymphatic vessels exiting the skull along the optic (II) and the trigeminal (V) nerves and through the cribriform plate (CP). CN, cranial nerve. (H) Lymphatic vessels associated with the glossopharyngeal (IX), vagus (X), and accessory (XI) nerves. XII, hypoglossal nerve. (I and J) Stereomicrographs of tissues in a Vegfr3+/LacZ reporter mouse showing the skull exit of dural lymphatic vessels along the PPA (I) and through the CP into a nasal concha. OB, olfactory bulb area. (K) Immunofluorescence of thick skull section for PECAM1, PROX1, and CCL21. bv, blood vessel; sas, subarachnoid space. (L–P) Whole-mount immunofluorescence staining of superior sagittal lymphatic vessels with antibodies against PECAM1 (L), LYVE1 (M), PDPN (N), CCL21 (O), VEGFR3 (P), and PROX1 (M–P). LYVE1 and PECAM1 colocalization is indicated with the dashed lines. n = 2–3 per staining. Data are from two to three independent experiments. Bars: (B–H and L–P) 100 µm; (K) 50 µm.

