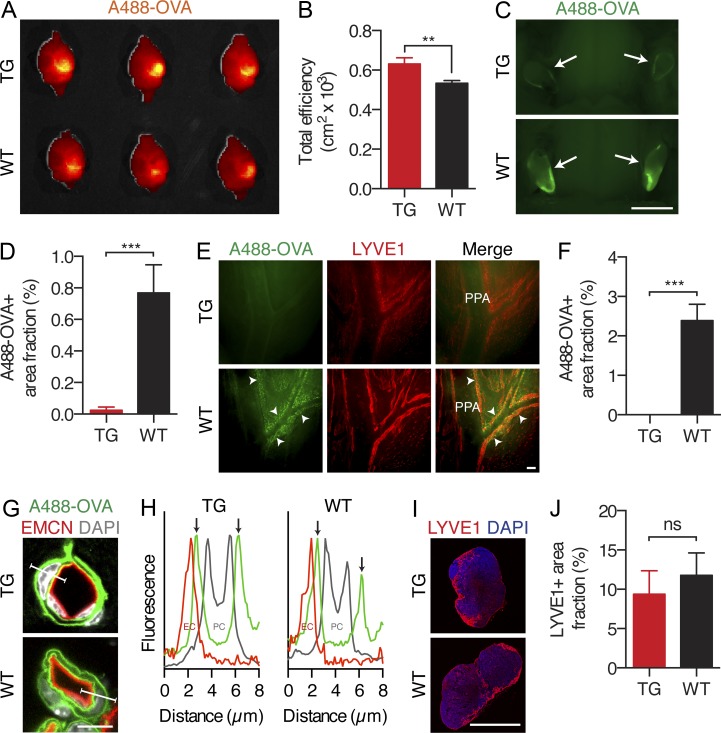
Figure 4.
Lack of dural lymphatic vessels compromises CNS macromolecule clearance. Analysis of A488-OVA distribution 2 h after intraparenchymal injection in K14-VEGFR3-Ig TG mice and WT littermate controls. (A and B) Representative false color maps and quantification of the epifluorescence efficiency in the brain using IVIS imaging. (C and D) Representative images and quantification of the fluorescence in the dcLNs (indicated by arrows). (E and F) Representative fluorescent images of the A488-OVA tracer (indicated by arrowheads) accumulation in the LYVE1-stained lymphatic vessels around the PPA and MMA, with quantification of the A488-OVA–positive signal. Note the partial leakage of the tracer from the vessels caused by the perfusion fixation. (G) Fluorescent images of brain sections stained with DAPI and antibodies against endomucin (EMCN), showing the A488-OVA tracer distribution in the glymphatic system. (H) Plot profile analysis of the fluorescence along the indicated lines in G, showing A488-OVA signal in the subendothelial and perivascular spaces (arrows) in both TG and WT mice. (I) Immunofluorescent images of dcLNs stained with DAPI and antibodies against LYVE1. (J) Quantification of the LYVE1+ area in the dcLNs in TG mice and WT littermate controls. (A, B, and G–J) n = 4 (TG) and 3 (WT). (C–F) n = 3 (TG) and 4 (WT). Data are representative of two independent experiments. Bars: (C) 2 mm; (E) 100 µm; (G) 8 µm; (I) 1,000 µm. Error bars indicate SD. Statistical analysis: two-tailed Student’s t test. **, P < 0.01; ***, P < 0.001.

