
Extended Data Figure 4.
Analysis of integral membrane protein substrates of the Asi E3 ubiquitin ligase.
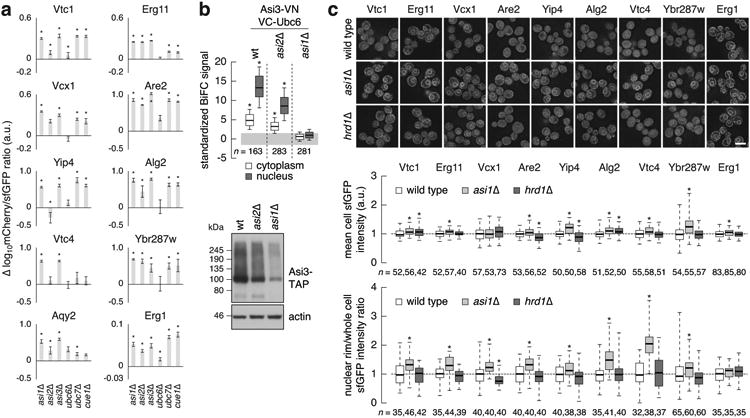
a, Differences in log10mCherry/sfGFP intensity ratio between the indicated mutants and the wild type (mean ± s.d., n = 4) for tFT-tagged proteins from the Asi cluster in Fig. 3b.
b, Quantification of BiFC signals in strains co-expressing VC-Ubc6 and Asi3-VN (top panel). BiFC signals were measured in the cytoplasm and nucleus of individual cells (n as indicated in the figure). Whiskers extend from 10th to 90th percentiles. A substantial BiFC signal is retained in the asi2Δ mutant, despite reduced expression of Asi3 (immunoblot, bottom panel).
c, Quantification of sfGFP signals in strains expressing tFT-tagged proteins from the Asi cluster in Fig. 3b. Fluorescence microscopy examples representative of five fields of view (top panel). Scale bar, 5 μm. sfGFP intensities were measured in individual cells (middle panel) and at the nuclear rim (bottom panel); a.u., arbitrary units. For each protein, measurements were normalized to the mean of the respective wild type. Whiskers extend from minimum to maximum values.