
Figure 1.
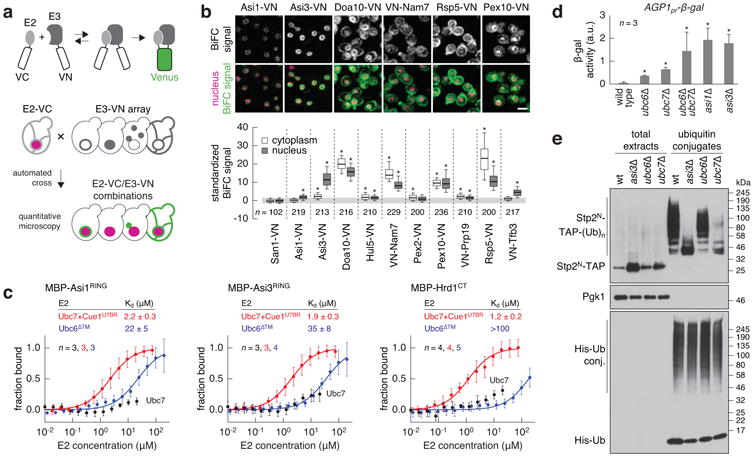
The Asi complex is a Ubc6/Ubc7-dependent E3 ubiquitin ligase of the INM.
a, BiFC strategy used to assay E2-E3 interactions. E2 and E3 proteins were endogenously tagged with C- and N-terminal fragments of the Venus fluorescent protein (VC and VN). Interactions between E2 and E3 proteins enable reconstitution of functional Venus that is detected with fluorescence microscopy. Rpn7-tDimer2 served as red nuclear marker.
b, Quantification of BiFC signals in cells co-expressing VC-Ubc6 and VN-tagged E3s. Fluorescence microscopy examples representative of six fields of view (top panel). Scale bar, 5 μm. BiFC signals were measured in the cytoplasm and nucleus of individual cells (bottom panel, n as indicated in the figure). Whiskers extend from 10th to 90th percentiles.
c, Microscale thermophoresis analysis of interactions between recombinant maltose binding protein (MBP)-E3 fragments and the indicated E2s. Plots show the fraction of MBP-E3 bound to the E2 at each tested E2 concentration (mean ± s.d., n as indicated in the figure). Dissociation constants (Kd, mean ± s.d.) were derived from non-linear fits with the law of mass action (solid lines).
d, Activity of β-galactosidase expressed from the AGP1 promoter in the indicated strains (mean ± s.d., n = 3clones); a.u., arbitrary units.
e, Ubiquitylation of Stp2N-TAP in strains expressing 10His-ubiquitin. Total cell extracts and ubiquitin conjugates eluted after immobilized-metal affinity chromatography were separated by SDS-PAGE followed by immune blotting with antibodies against the TAP tag, Pgk1 and ubiquitin. Representative immune blots from 3 technical replicates.
Statistics: (b) One-way ANOVA with Bonferroni correction for multiple testing. *P<10-4. (d) Two-tailed t-test. *P<0.05.