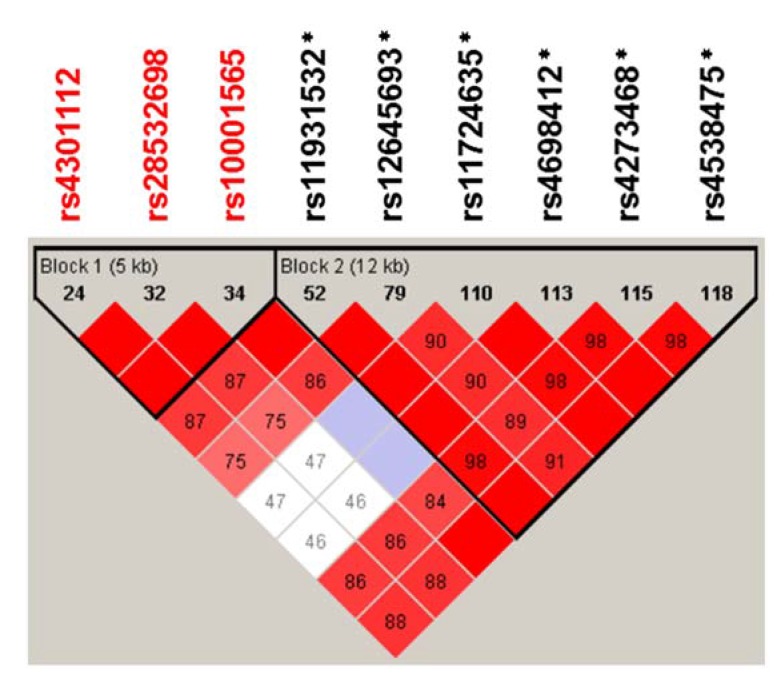
Figure 2.
Linkage disequilibrium plot of the CD157/BST1 gene in the sample studied. Numbers in the squares indicate D′ values. Rs numbers in red represent SNPs that showed significant association with ASD in this study; asterisks denote those previously reported as Parkinson’s disease-associated markers [21,23,24,25,27,28,29,30].

