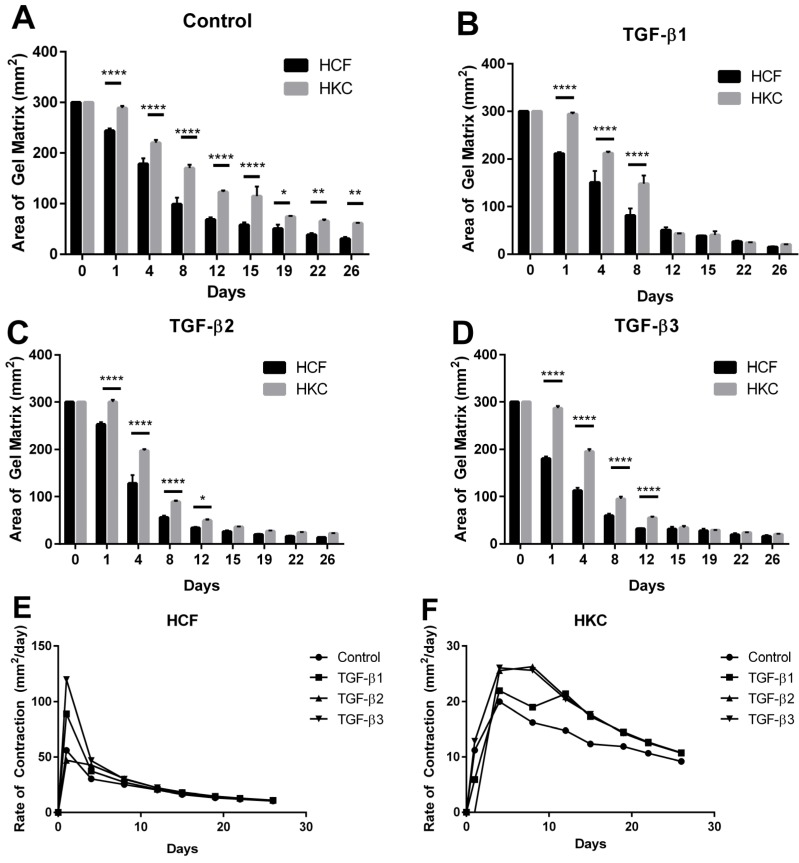
Figure 2.
Quantification of the contraction of the collagen matrix in HCFs and HKCs from day 0 to 26. (A) control, (B) TGF-β1, (C) TGF-β2, and (D) TGF-β3 samples. A significant reduction in area of the collagen matrix correlates with increased contractility. Rate of contraction from day 0 to day 26 for (E) HCFs and (F) HKCs. n = 3, error bars represent standard error of the mean (SEM). (**** denotes p < 0.0001, *** denotes p < 0.001, ** denotes p < 0.01, and * denotes p < 0.05.)

