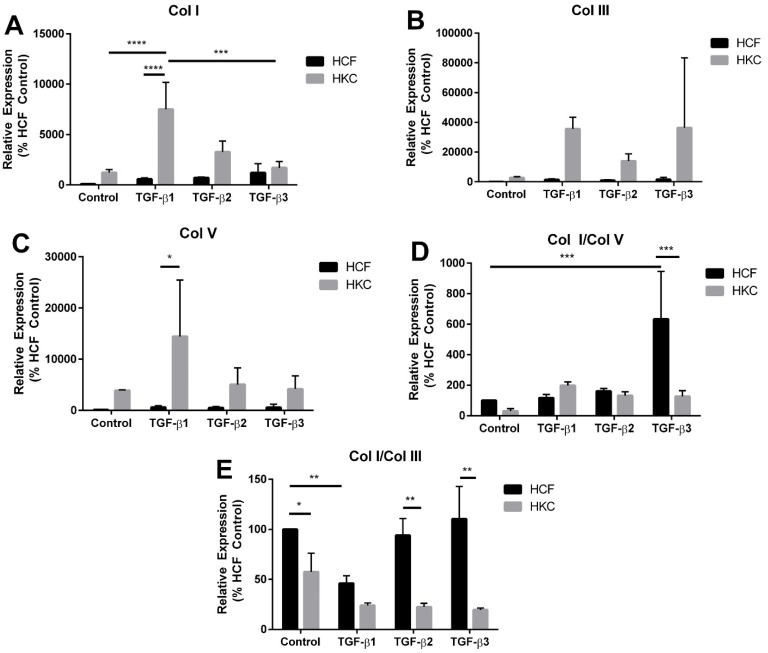
Figure 4.
(A) Collagen I (Col I), (B) Collagen III (Col III), and (C) Collagen V (Col V) expression and (D–E) ratios of Col I/Col V and Col I/Col III by HCFs and HKCs at week 4 measured by RT-PCR. n = 3, error bars represent standard error of the mean. (**** denotes p < 0.0001, *** denotes p < 0.001, ** denotes p < 0.01 and * denotes p < 0.05.)

