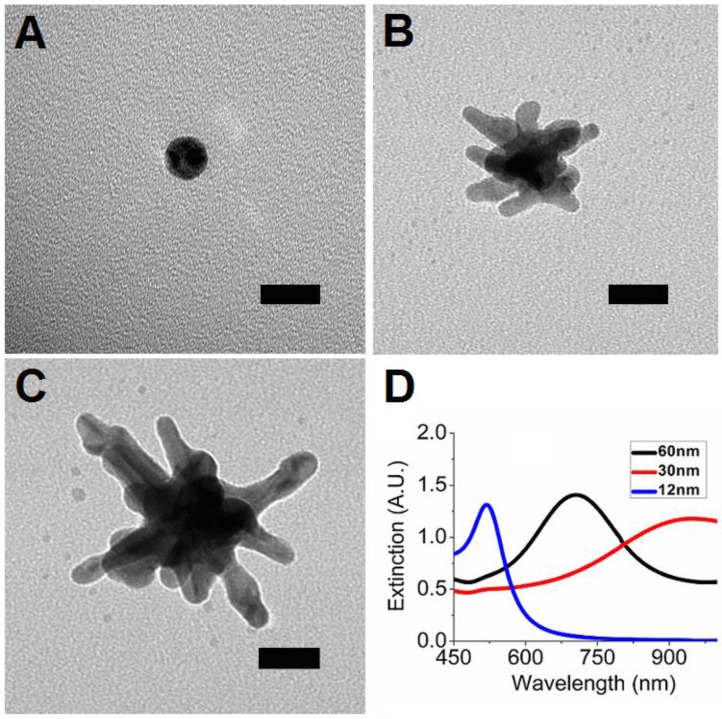
Figure 1.
TEM images of 12-nm gold nanospheres (A), 30-nm GNS (B), and 60-nm GNS (C). UV-Vis spectra of 12-nm gold nanospheres, 30-nm GNS, and 60-nm GNS solutions (D). The plasmon peaks are 520 nm for 12-nm nanospheres (5 nM), 945 nm for 30-nm GNS (0.2 nM), and 706 nm for 60-nm GNS (0.1 nM), respectively. Scale bar is 20 nm in all images.

