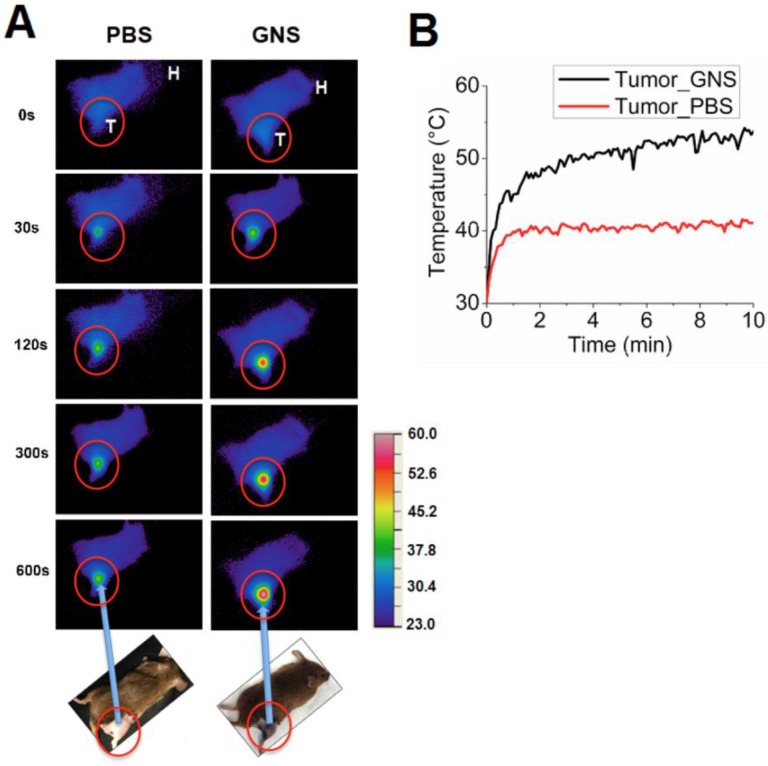
Figure 8.
(A) Near-infrared imaging of mouse surface temperature during photothermal treatment of primary sarcomas after intravenous injection of PBS or 30-nm GNS. Each image shows the surface temperature plot of the whole mouse, with the tumor circled in red. T represents the mouse tumor and H represents the mouse head. The temperature scale bar is between 23° C and 60 °C. (B) In vivo profile of the average surface temperature of primary sarcomas with and without injection of GNS measured by a calibrated IR camera.

