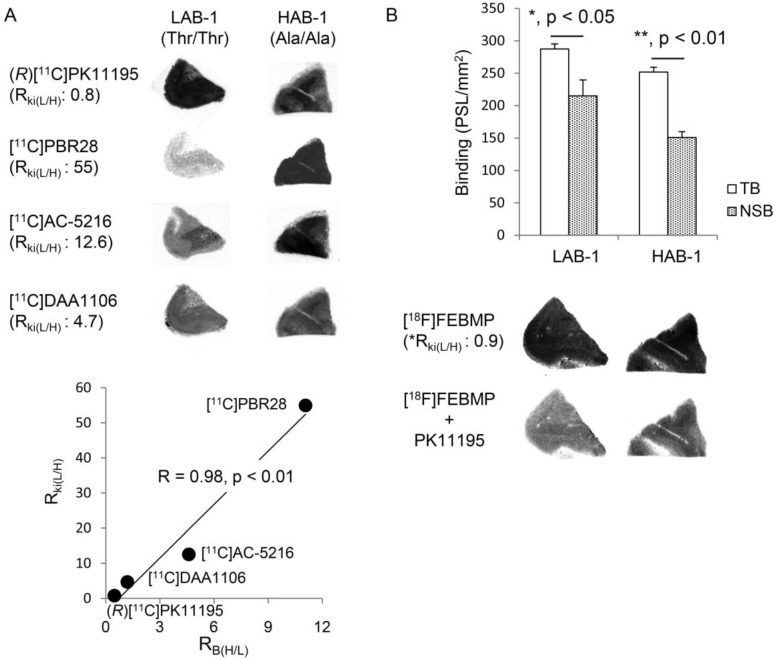
Figure 4.
In vitro autoradiographic analysis of the human brain. (A) Autoradiographic images of (R)[11C]PK11195, [11C]PBR28, [11C]AC-5216, and [11C]DAA1106 in brain sections containing the temporal cortex from LAB-1 and HAB-1. The binding ratios of (R)[11C]PK11195, [11C]DAA1106, [11C]AC-5216 and [11C]PBR28 for HAB-1 to that of LAB-1 (RB(H/L)) were approximately 0.45, 1.19, 4.60, and 11.1, respectively, showing excellent correlation (R = 0.98, p < 0.01) with the Ki ratios of these ligands for LAB to that of HAB (RKi(H/L)). The corresponding values of RKi(H/L) of these lignads were 0.8, 4.7, 12.6 and 55, respectively, published in previous studies (Owen et al, 2011a, 2011b). (B) Autoradiographic images of [18F]FEBMP and quantitative analysis. Total binding (TB, PSL/mm2; mean ± SEM) and non-specific binding (NSB, PSL/mm2; mean ± SEM) were calculated in the absence and presence of unlabeled PK11195, respectively (3 and 5 brain sections for the NSB and TB assay, respectively; *, p < 0.05, **, p < 0.01; student's t-test for TB vs NSB). The RB(L/H) value of [18F]FEBMP was determined to be 0.90 from the bar graph. *The RKi(L/H) value (0.9) of [18F]FEBMP was calculated by extrapolation from the linear curve (A) and RB(L/H) value.

