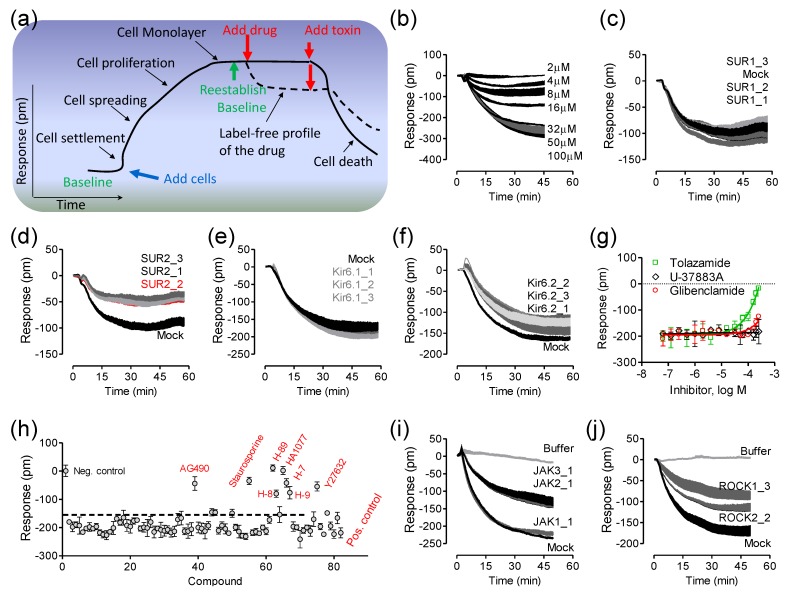
Figure 4.
Label-free cell phenotypic assays for decoding receptor composition and signaling. (a) A hypothetical kinetic response of living cells on the sensor surface; (b) The real-time DMR dose responses of pinacidil in HepG2C3A cells; (c–f) The DMR of 40 µM pinacidil in the mock- transfected cells, in comparison with those in cells treated with three different SUR1 RNAi (c); SUR2 RNAi (d); Kir6.1 RNAi (e); or Kir6.2 RNAi (f); (g) The DMR of 32 µM pinacidil as a function of different KATP blockers; (h) The sensitivity of 32 µM pinacidil DMR to kinase inhibition, plotted as its amplitudes at 50 min post stimulation as a function of compound; (i) The real-time DMR of 40 µM pinacidil with mock transfection (mock) or JAK siRNA; (j) The real-time DMR of 40 µM pinacidil with mock transfection (mock) or ROCK siRNA. For (c–f) and (i–j), RNAi transfection was done 48hrs prior to the pinacidil stimulation. For (g,h), the cells were first treated with each blocker for 1hr, followed by stimulation with 32 µM pinacidil. For (i) and (j), the buffer DMR was included as a negative control. Data represents mean ± s.d. (n = 6 for a–f, n = 3 for g, n = 4 for h, n = 6 for i and j). This figure is reproduced from Ref. [14] through the Creative Commons Attribution License.

