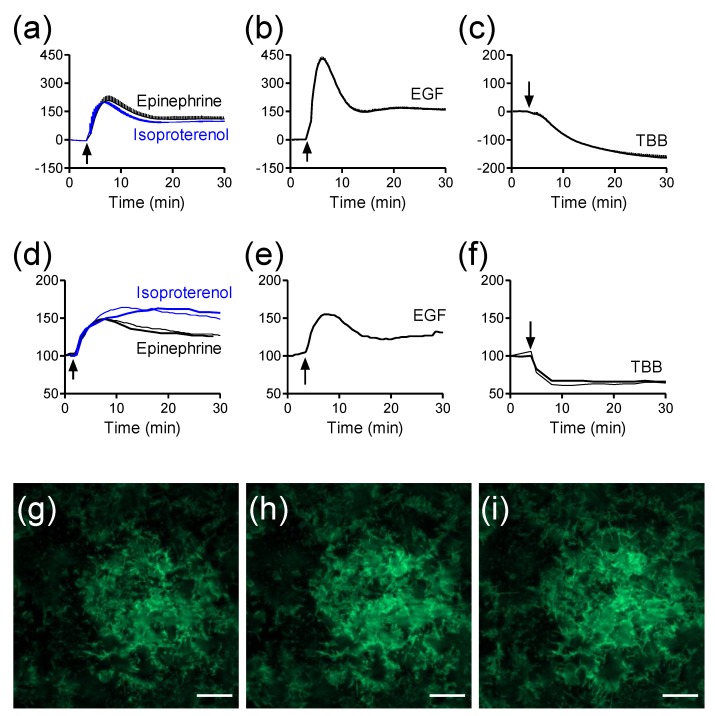
Figure 5.
The label-free and TIRF profiles of receptor activation in HEK293-β2AR-GFP cells. (a–c) Real-time DMR signals induced by 10 µM epinephrine and 10 µM isoproterenol (a); 32nM EGF (b); and 10 µM TBB (c); (d–f) Real-time TIRF signals induced by 10 µM epinephrine and 10 µM isoproterenol (d); 32nM EGF (e); and 10 µM TBB (f); (g–i) TIRF images before (g), and 2 min (h) and 10 min (i) after the stimulation with 10 µM epinephrine. The data in (a–c) shows mean ± s.d. of eight replicates. Scale bar in g–i is 10 µm. This figure is reproduced with permission from Ref. [25].

