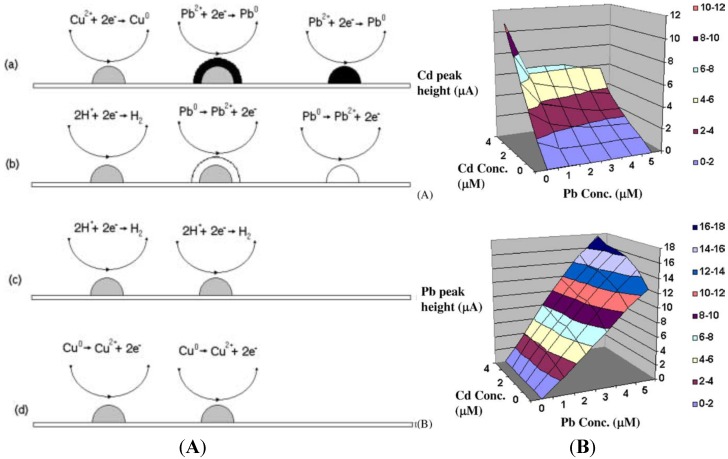
Figure 5.
(A) Schematic diagram for the deposition and stripping processes. (a) The potential is maintained at −1.0 V where lead and copper deposits are formed but the latter are quickly covered by reduced lead. (b) When scanning in the positive direction, lead is first oxidized, (c) leaving copper deposits exposed, and hydrogen evolution takes place. (d) Continuing scanning at potentials E > 0.0 V Cu deposits are oxidized; (B) Three-dimensional calibration curves for the differential pulse anodic stripping currents for (a) Cd (II) (b) Pb (II) in acetate buffer solutions containing both metals. Reprinted from [64], with permission from Elsevier.

