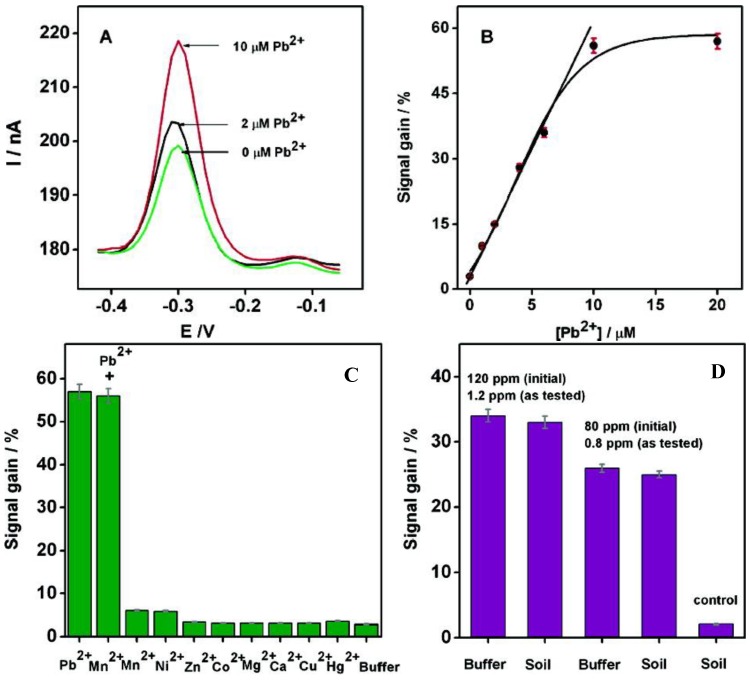
Figure 16.
(A) Square wave voltammograms after 1 h incubation at increasing concentrations of Pb2+; (B) Calibration curve; (C) Specificity and selectivity experiments; (D) Current changes obtained from soil extracts spiked with given lead concentrations, versus control. Reprinted with permission from [119]. Copyright 207 American Chemical Society.

