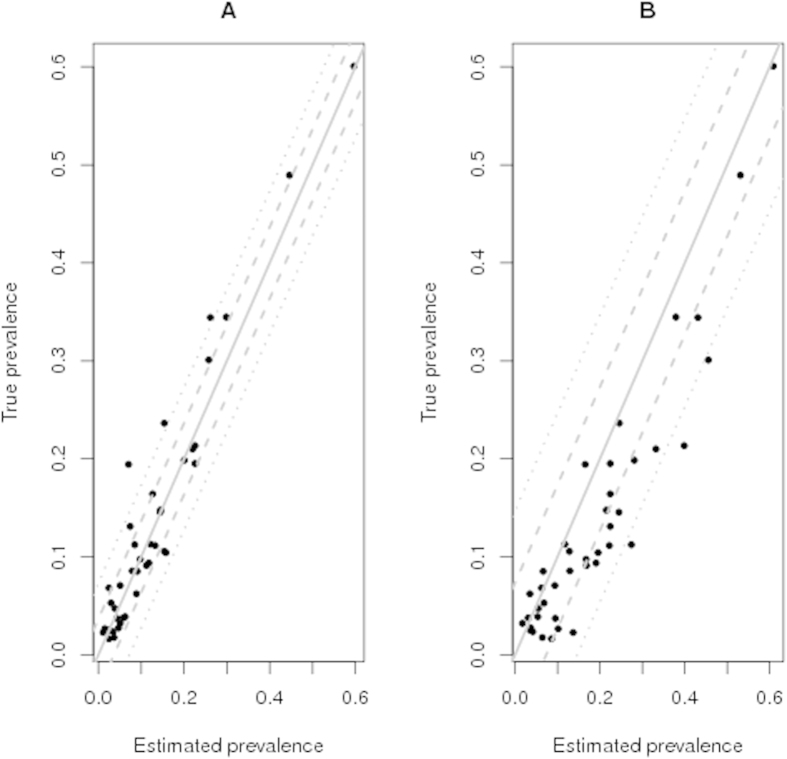
Figure 2. The relationship between input and output estimated true prevalence values from the extended six.
(A) and traditional four (B) cell conditional independence including outbreak specific sensitivities from the simulation study. The grey line superimposed onto the plot represents a regression coefficient of 1 between the parameters (with the dashed and dotted grey lines representing one and two root mean square errors from the regression line respectively).

