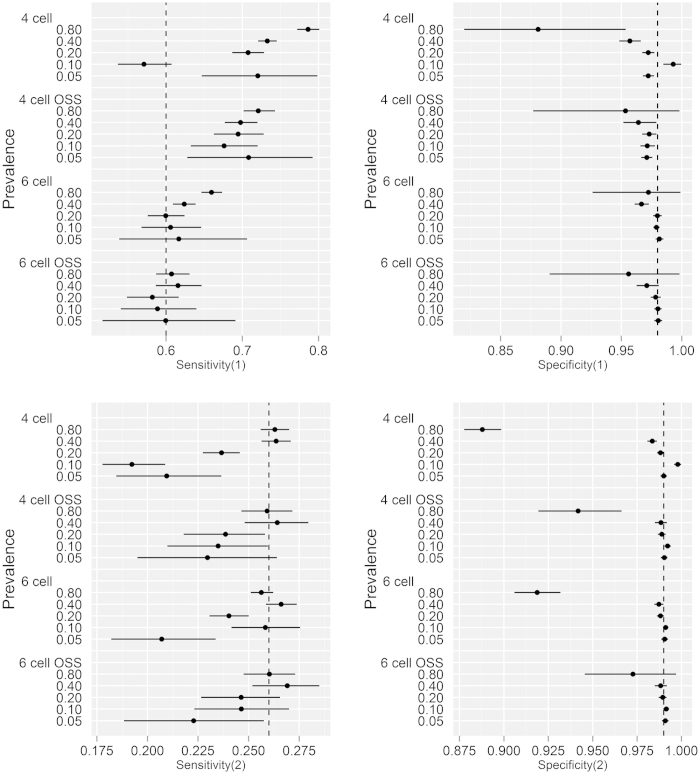
Figure 4. Parameter estimates (with 95% Bayesian credibility intervals) of diagnostic sensitivity and specificity for the single intradermal comparative tuberculin test.
(1) and abattoir inspection (2) from the simulated data sets from the traditional 4 and extended 6 cell conditional independence model excluding/including outbreak specific sensitivities (OSS). The simulated data was reconstructed using parameter estimates from the Northern Ireland surveillance data; with true prevalence ranging from 0.05 to 0.80. The broken perpendicular lines on each of the plots represent the simulation input value for the respective parameters. Modelling OSS improved the precision; whereas the 6 cell extension augmented the accuracy of the parameter estimates in the absence of conditional dependence between the diagnostic tests.

