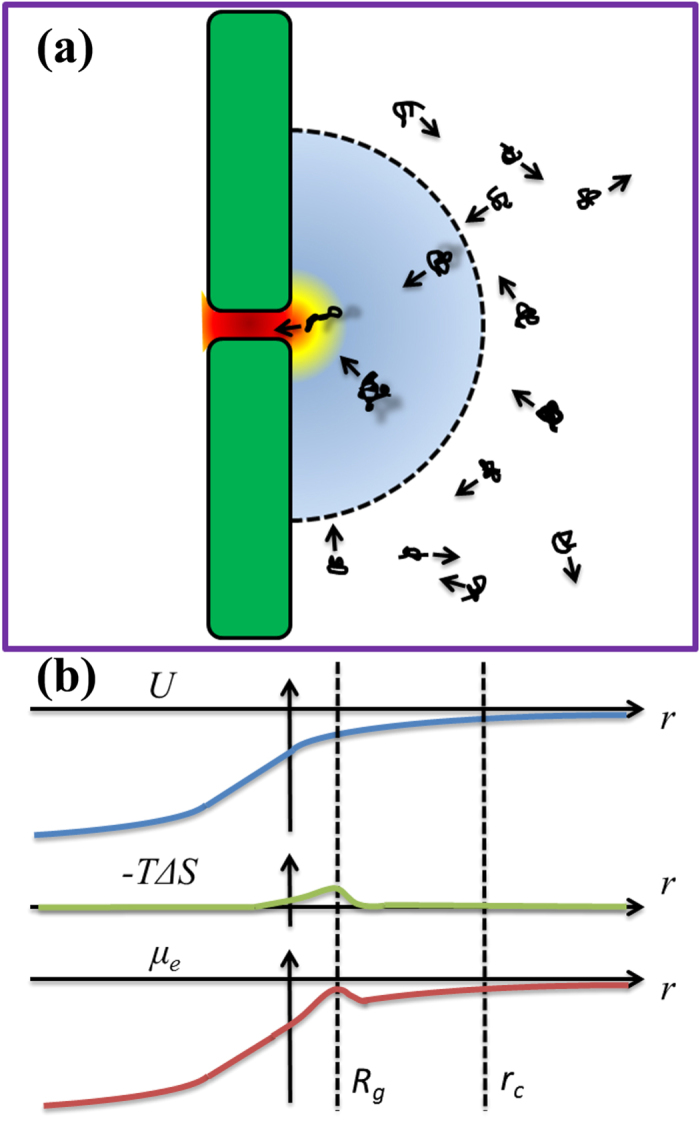
Figure 1.

(a) Schematic for the capture of DNA molecules into the nanopore. The dash line illustrates the absorbing boundary within which the driving force prevails over the diffusion effect. The arrows illustrate the motion of DNA molecules. The entropy barrier is near the pore opening by a distance of Rg. (b) The distribution of electric potential (U), entropic cost (−TΔS), and electrochemical potential (μe) as a function of distance r from the pore center. The dash lines indicate the position of entropy barrier and absorbing boundary.
