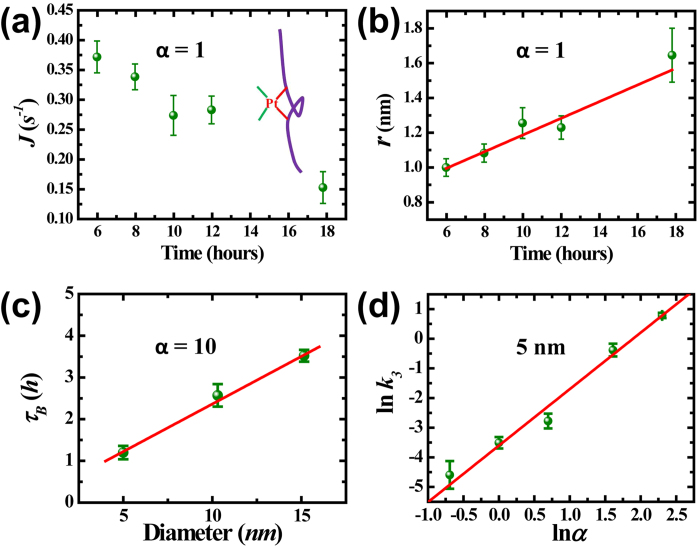
Figure 5. Stage III.
(a) Capture rate J versus reaction time. Inset: schematic of DNA micro-loop and crosslink formed by di-adduct. ΔV = 200 mV, d = 5.3 nm. (b) Effect radius r versus reaction time. (c) Aggregation time τB versus nanopore diameter with concentration α = 10, ΔV = 500 mV. The solid lines in (b) and (c) are linear fits. (d) The correlation between rate constant k3 and concentration ratio α. Solid line is a linear fit with slope equals 1.9 ± 0.1.

