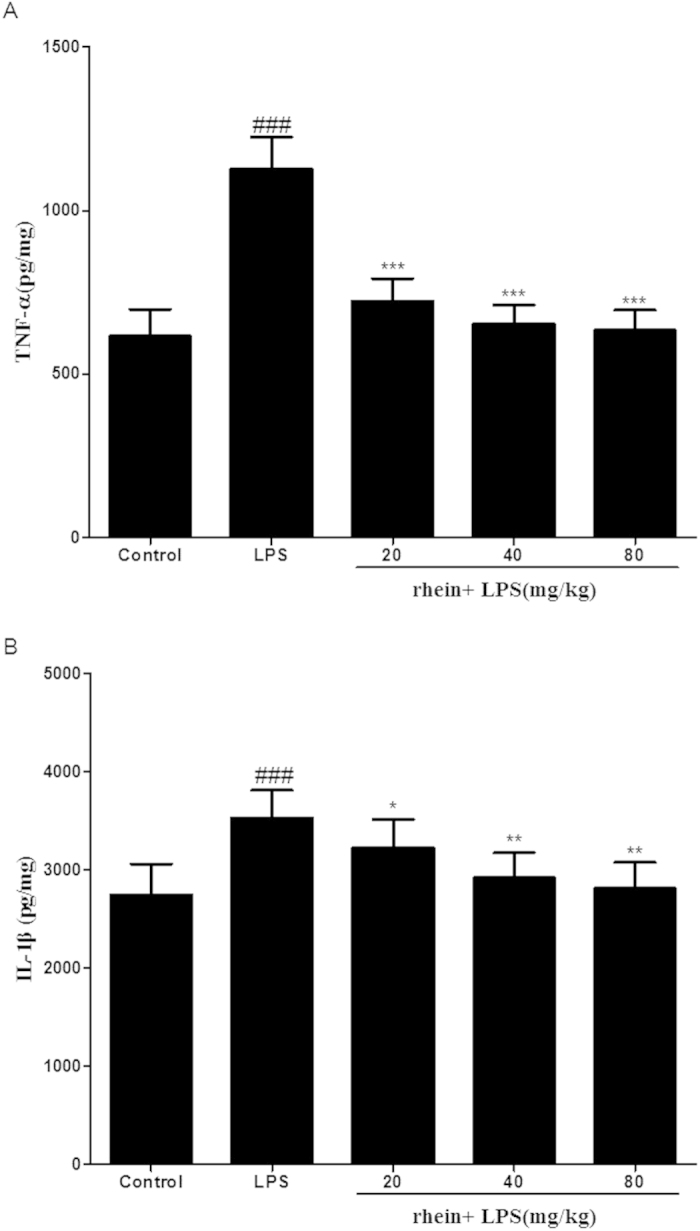
Figure 4.

The effect of rhein on TNF-α (A) and IL-1β (B) levels after LPS challenge. Quantitation of TNF-α and IL-1β in renal tissue was performed by ELISA. Data are represented as mean ± SD of 10 animals of each group. ###p < 0.001 compared to control group; *p < 0.05, **p < 0.01 and ***p < 0.001 compared to LPS group.
