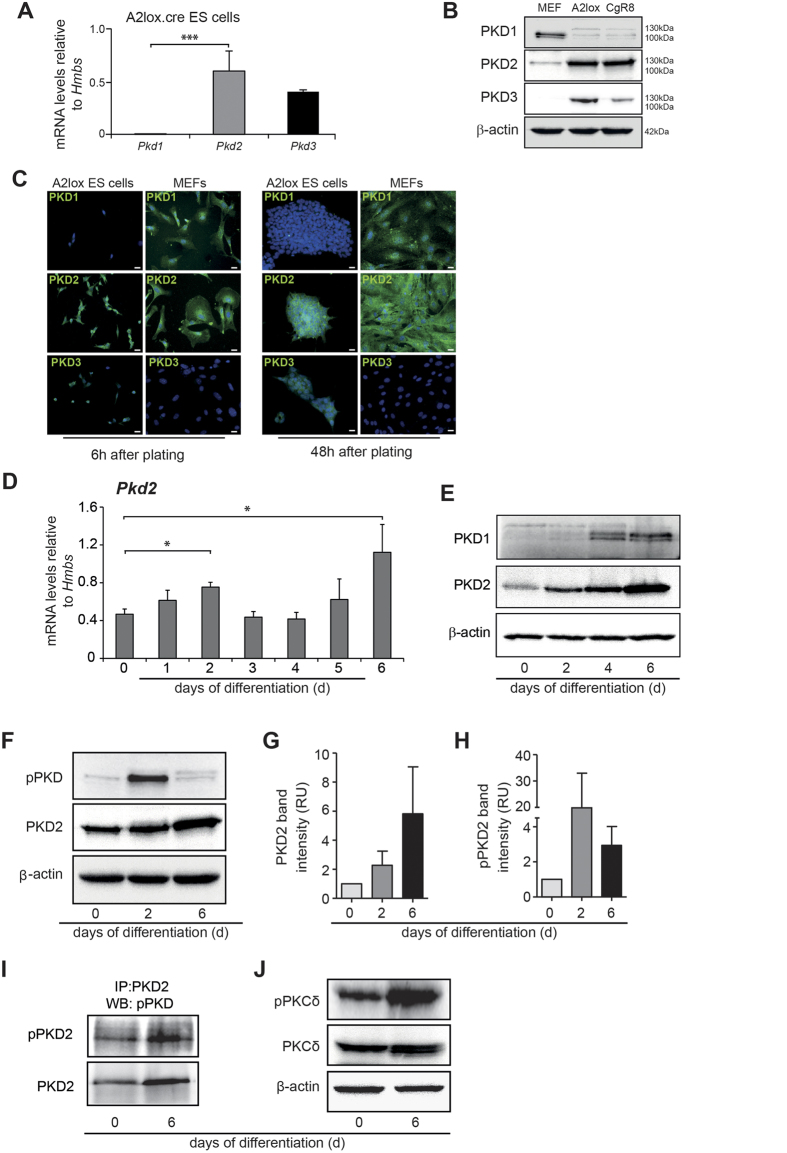
Figure 1. Expression of PKD isoforms in mouse embryonic stem cells.
(A) mRNA levels of PKD 1/2/3 in undifferentiated A2lox mouse ESCs. (B) Western Blot analysis of PKD1/2/3 in A2lox.cre and CgR8 ESCs. MEFs served as positive control. (C) Immunofluorescence staining for PKD1, PKD2 and PKD3 (green) in undifferentiated A2lox mES cells 6 h and 48 h after plating under pluripotency conditions. Nuclei are stained with DAPI (blue). MEFs served as positive control. (D) PKD2 mRNA expression levels during EB differentiation until day 6 of ESCs. (E) Western blot analysis of PKD1 and PKD2 protein levels during differentiation until day6 in differentiating ES cells. (F) Western Blot of phospho-PKD and PKD2 indicating catalytic activity by phosphorylation within the activation loop at two conserved serine residues. (G,H) Relative band intensity of PKD2 (G) and pPKD2 (H) days 0, 2 and 6. Two experiments of three included into the quantification. (I) Immunoprecipitation of phospho-PKD2 (pPKD2) and PKD2 on Days 0 and 6. (J) Western Blot of PKCδ and phospho-PKCδ on Days 0 and 6. qPCRs were performed n = 3 in replicates. Western Blots are representative for three independent experiments. Scale bars 20 μm.

