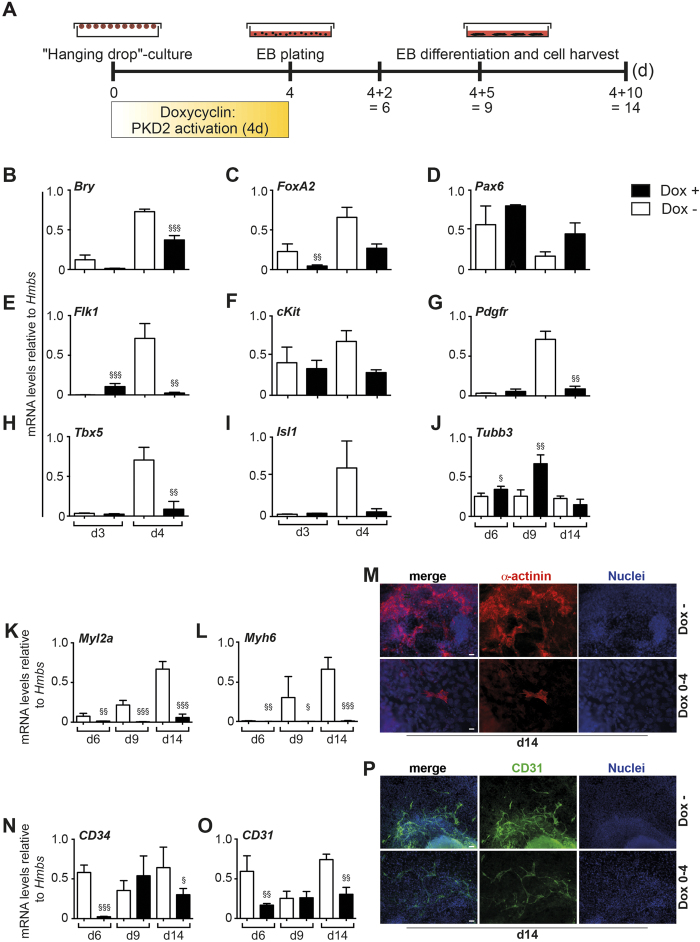
Figure 3. Effects of early PKD2 overexpression from day 0–4.
(A) Scheme illustrating treatment regimen of iPKD2 ES cells from the beginning of EB culture until cell harvest for qPCR analysis. (B–D) qPCR analysis depicting expression levels of different germ layers markers: Mesoderm - Brachyury (Bry); Ectoderm - Pax6; Endoderm -FoxA2. (E–G) qPCR analysis illustrating expression of hemangioblast and cardiovascular progenitor markers: hemangioblast/angioblast - Flk1; hemangioblast - c-kit; cardiac -PDGFR. (H,I,K,L) qPCR analysis illustrating expression of early cardiac markers, (H,I) Tbx5 and Isl1 and late cardiac markers (K,L) Myh6, Myl2a. (J) Tubb3 marks neuronal differentiation at later time points. (M) α-actinin staining of Conditions Dox – and Dox 0–4 at day 14 of differentiation. Cultures were stimulated as illustrated in (A). (N–O) qPCR analysis illustrating expression of late vascular markers, CD34, CD31 in Dox – and Dox 0–14 conditions. (P) CD31 staining at day 14 of differentiation. Cultures were stimulated as illustrated in (A). Time points as indicated in the figure and treatment regimen as indicated in the figure. All experiments were performed n = 3 in replicates. Scale bars 20 μm. Significances were calculated using R. Raw p values were adjusted using Bonferroni correction (§p < 0.05; §§p < 0.01; §§§p < 0.001). Adjusted p-values are listed in Suppl. Table 1.

