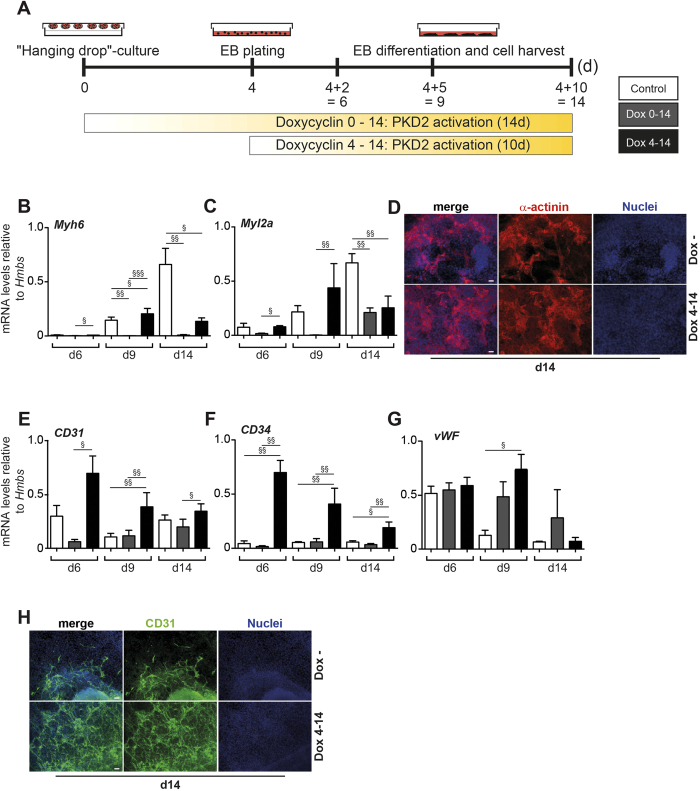
Figure 4. Effects of PKD2 over expression after day 4 of EB development.
(A) Scheme illustrating treatment regimen of iPKD2 ES cells. (B,C) mRNA levels of late cardiac markers Myh6 and Myl2a. (D) Immunostaining of α-actinin at day 14 of differentiation. (E–G) mRNA levels of vascular markers CD31, CD34 and von Willebrand factor (vWF). (H) Immunostaining of the vascular protein CD31 in Dox− an Dox 4–14 conditions. Time points and treatment regimen as indicated in the figure. All experiments were performed n = 3 in replicates. Scale bars 20 μm. Significances were calculated using R. Raw p values were adjusted using Bonferroni correction (§p < 0.05; §§p < 0.01; §§§p < 0.001). Adjusted p-values are listed in Suppl. Table 2.

