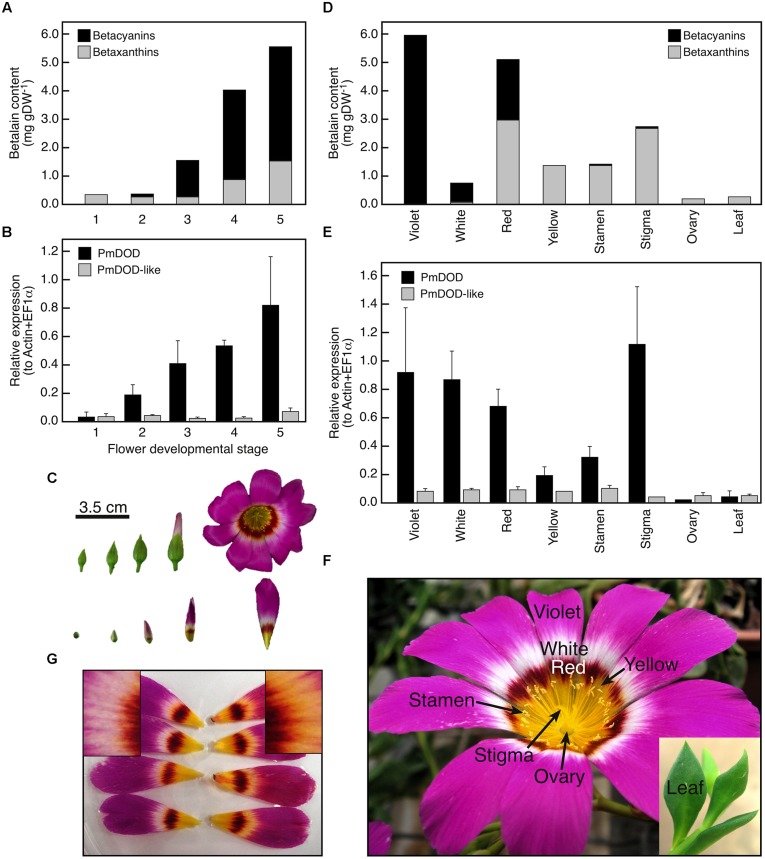
FIGURE 2.
Spatio-temporal patterns of betalain accumulation and DOD and DOD-like expression in Parakeelya mirabilis. Accumulation (A) and expression (B) in petals during flower development (C), and accumulation (D) and expression (E) in different colored petal sectors (developmental stage 5) and other organs (F). Relative expression was determined by qPCR and normalized to the geometric mean of EF1α and ACT expression. SE for three biological replicates is shown. (G) Shows petals fed a control solution (left) or a solution containing DOPA (right). The inserts show a magnification of the white petal region, with yellow pigmentation apparent in the DOPA but not control fed petals.

