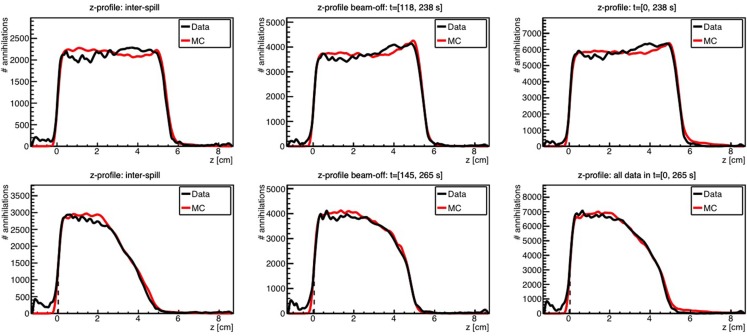
Figure 10.
Top: 1-D profile along the z-axis of the measured (black) and MC simulated activity (red) induced by a 95 MeV proton beam impinging on a PMMA target during 118 s. Bottom: the same but for the 2 Gy treatment plan, delivered in 145 s. Inter-spill (left), beam-off (center), and all together (right) are displayed separately. Adapted from Ref. (116).

