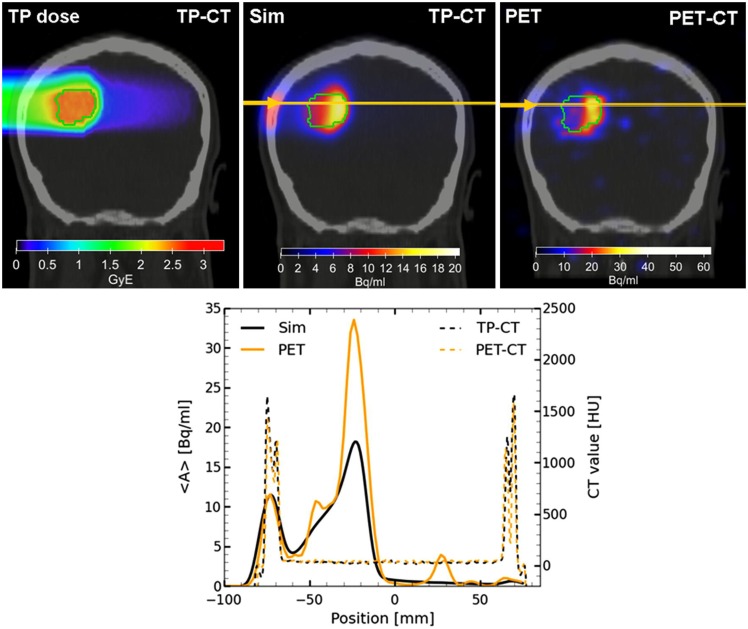
Figure 11.
Top left: colourwash overlays of the planning CT image (TP-CT) in the coronal view with the RBE-weighted dose distributions as obtained from the TP system (TP dose). Top center: the simulated activity pattern overlaid on the PET-CT image (Sim). Top right: the measured PET image (PET) overlaid on the PET-CT image. The solid green line marks the planning target volume. Bottom: the profile plot of the simulated and the measured activity (solid) as well as the corresponding CT image values (dashed) along the yellow line in panels Sim and PET in beam direction. Reproduced from Bauer et al. (125), with permission.

