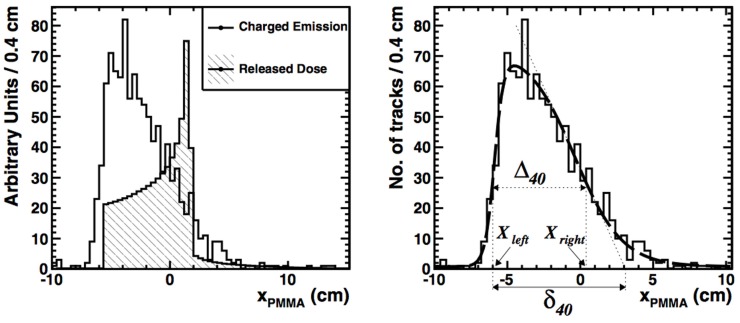
Figure 14.
Left: FLUKA simulation of the depth-dose profile (hatched histogram) superimposed on the longitudinal profile of charged secondary particles (solid line) as a function of xPMMA, the primary beam direction. Right: the corresponding data (histogram) and data analysis (smooth line). Reproduced from Ref. (194), with permission.

