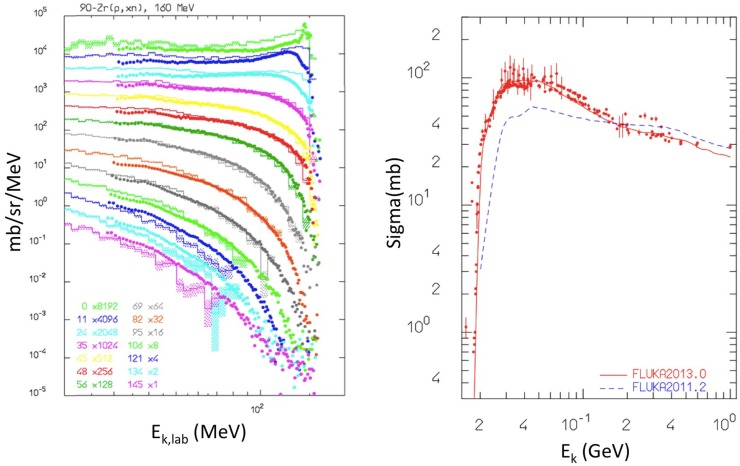
Figure 6.
Left: double differential energy spectra of emitted neutrons at different angles, from 160 MeV protons impinging on a Zr target. Histograms are FLUKA results, points are experimental data from Ref. (61, 62). Reproduced from Ref. (51), with permission. Right: cross section for nat12C(px)11C production from protons irradiation as computed with fluka2013.0 (red, upper curve), and fluka2011.2 (blue, lower curve) compared with data retrieved from the EXFOR library (28). Reproduced from Ref. (55), with permission.

