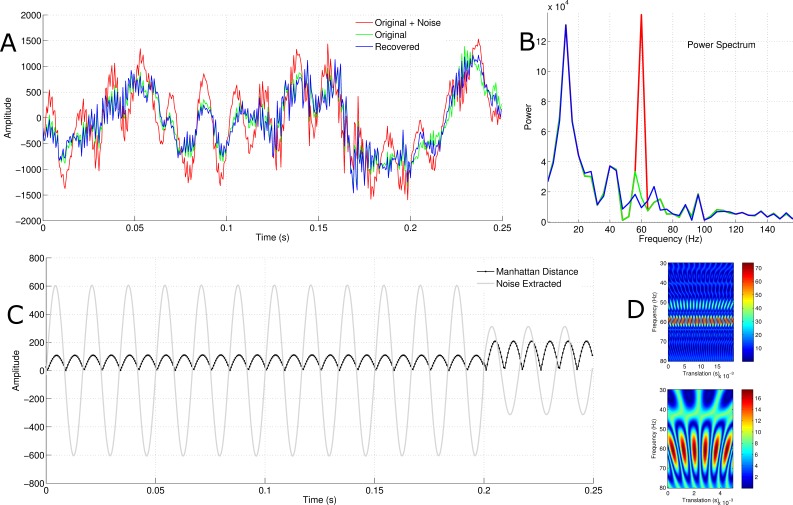
Figure 2. Independent component selection, signal reconstruction and the effect of time window.
(A) The blue, green and red signals are the recovered, original and noised signals respectively. (B) The blue, green and red signals are the power spectrum for the recovered, original and noised signals respectively. (C) The grey trace is the AC noise extracted and the black trace is the Manhattan distance between the original signal and the recovered signal. (D) The upper image is the pseudo-convolution of the selected independent component for the first 200 ms of the data. The lower represents that of the final 50 ms. Note that they both peak at circa 60 Hz.

