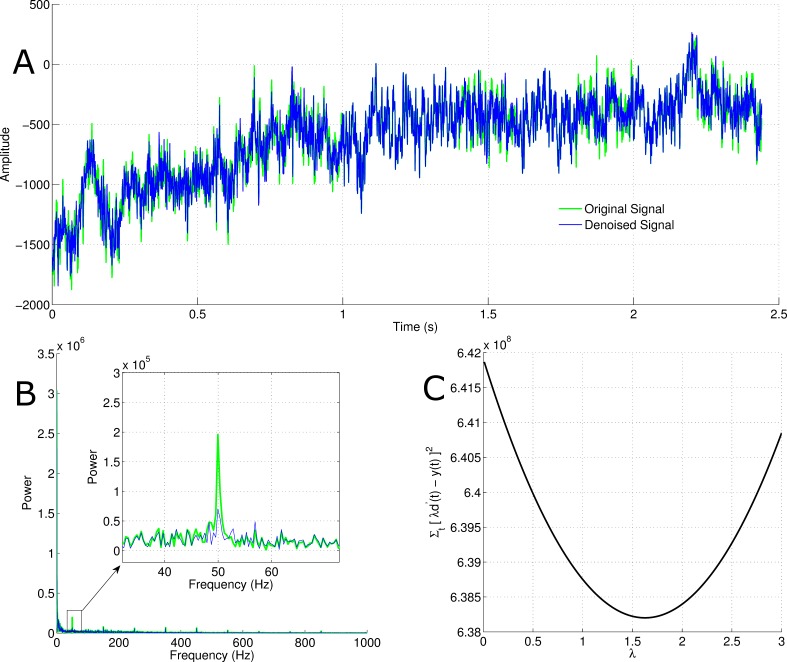
Figure 3. Learning the amplitude of powerline noise in a natural context.
(A) The green trace is the original signal and the blue trace is the reconstructed signal after removing natural 50 Hz AC noise. (B) The green trace represents the power spectrum for the original signal and the blue one represents that of the reconstructed signal. (C) This shows the process by which the noise amplitude is learned by the algorithm.

