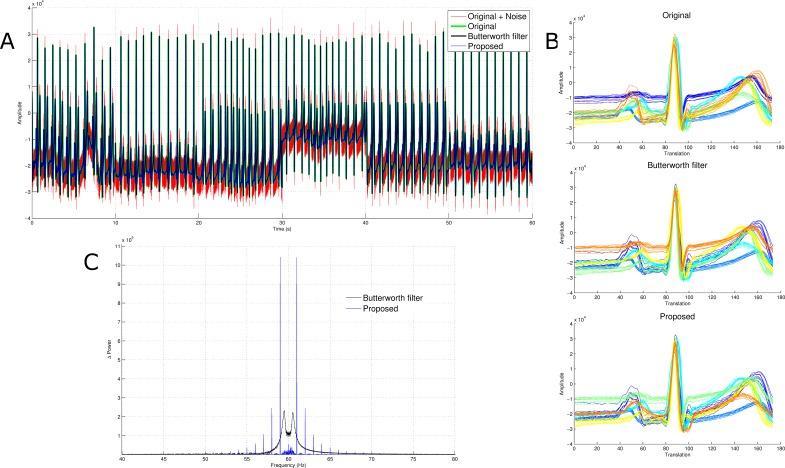
Figure 6. Comparison of power spectra and waveforms.
(A) The red, green, black and blue traces are the adulterated signal, original signal, signal obtained after Butterworth filter and signal obtained using the proposed denoising framework. (B) The waveforms detected via k-means without dimensionality reduction. (C) The blue signal is the Manhattan distance between the Fourier transform of the results from the proposed approach and the original signal. Similarly, the black trace is the Manhattan distance between the Fourier transform of the signal obtained via Butterworth filtering and the original signal.

