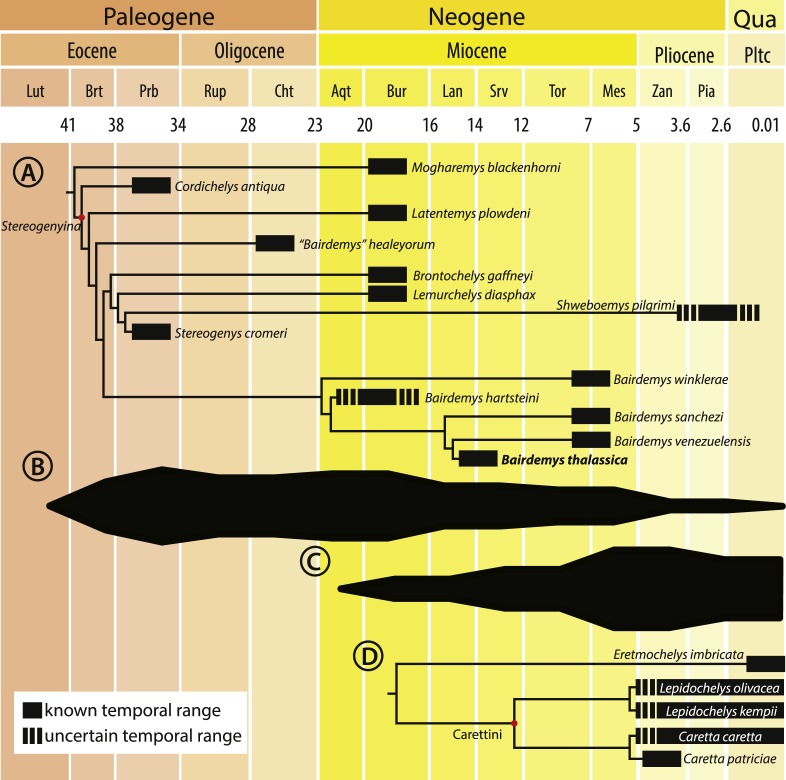
Figure 8. Cladogram calibrated on a time scale and species diversity plot.
Cladogram calibrated on a time scale (A and D) and species diversity plot based on the count of lineages on each age (B and C), from the Eocene to the present, for Stereogenyina (A and B) and Carettini turtles (C and D, cladogram based on Parham & Pyenson, 2010). Layout modified from Romano et al. (2014)).

