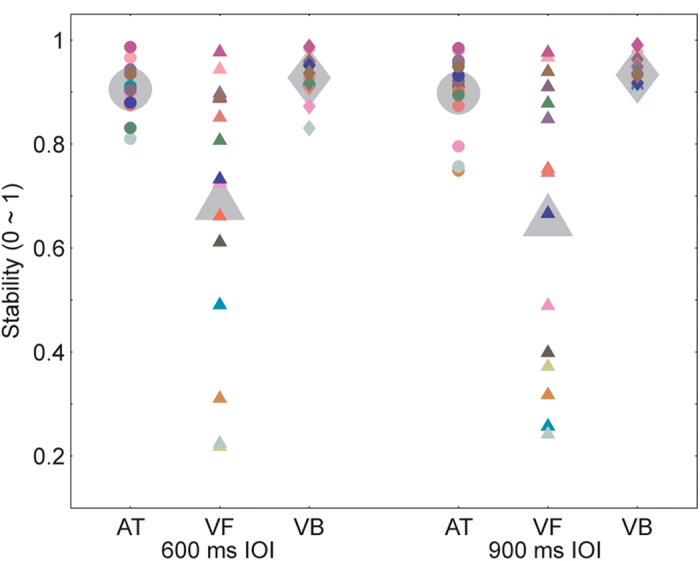
Figure 2. Results of experiment 1.

Tapping was most stable for the visual bouncing ball sequence. The mean synchronization stabilities are indicated by the large gray marks. The data from individual subjects are indicated by the small marks of different colors, which indicate different subjects. AT, VF and VB represent the auditory tone sequence, visual flashing ball sequence, and visual bouncing ball sequence, respectively.
