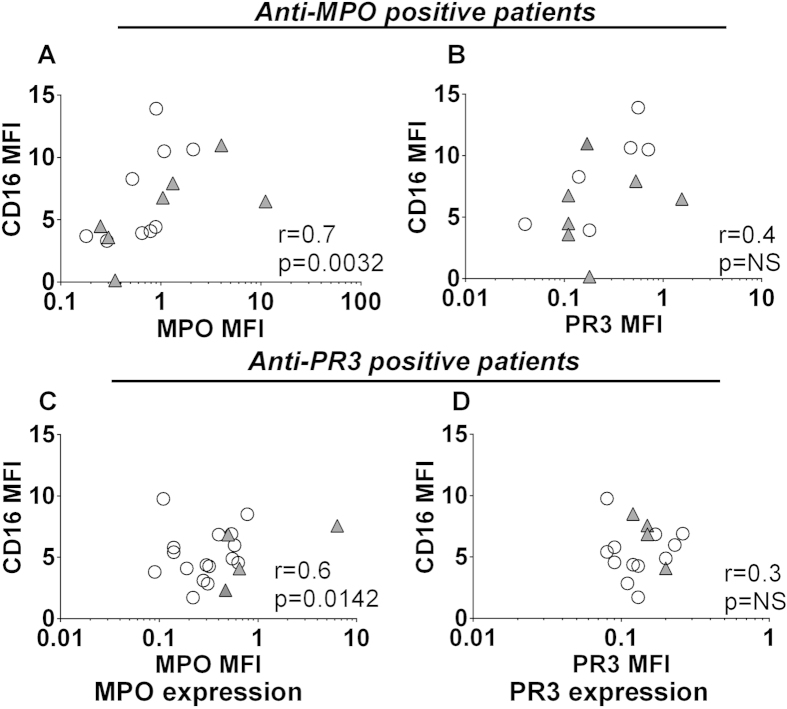
Figure 5. MPO and CD16 expression are correlated on intermediate monocytes.
Peripheral blood was collected from patients with AAV and analysed by flow cytometry. Following gating on intermediate monocytes the MFI of CD16 was plotted against that of MPO or PR3. Data presented show (A–B) anti-MPO+ AAV patients, (C–D) anti-PR3+ AAV patients. Each symbol represents an individual patient. Open circles represent patients in remission and filled triangles show patients with active disease. Correlation was tested by Spearman Rank Test.

