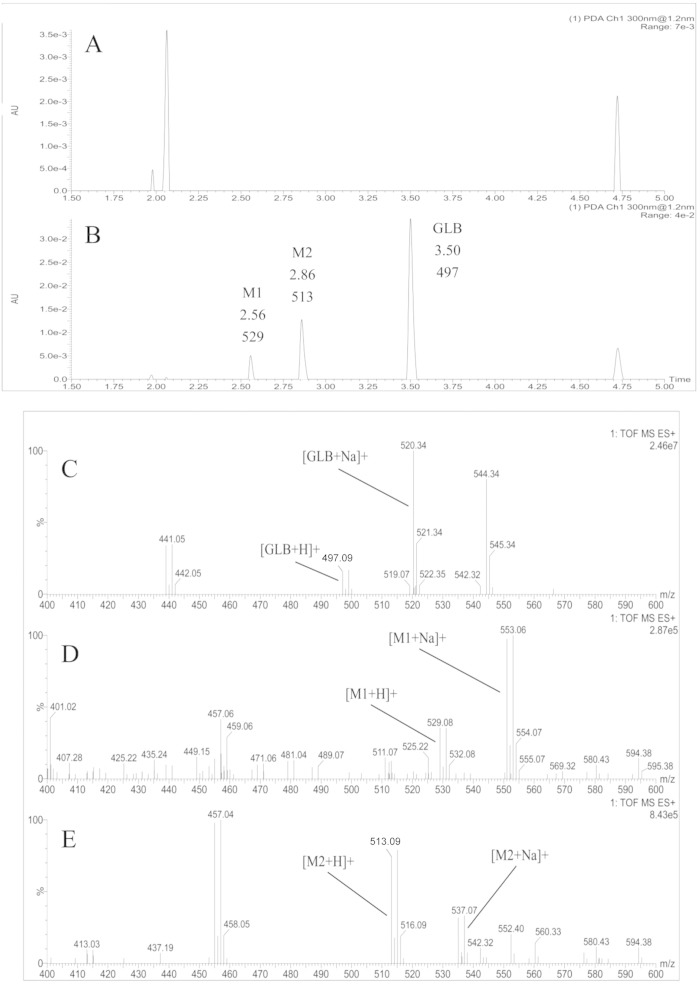
Figure 3. Representative UPLC chromatograms and tandem ESI-QTOF-MS mass spectrograms of.
(A): blank rat plasma; (B): GLB (3.50 min and m/z 497.09), metabolite M1 (2.56 min and m/z 529.08) and M2 (2.86 min and m/z 513.09) in a rat plasma sample at 6 h after oral administration GLB (100 mg/kg); (C): mass spectrograms of the parent compound GLB; (D): metabolites M1 and (E): metabolites M2 in positive scan mode using electrospray ionization (ESI) and in-source collisionally induced dissociation detected by UPLC-QTOF-MS/MS in a rat plasma sample at 6 h after a single oral administration of GLB (100 mg/kg).

