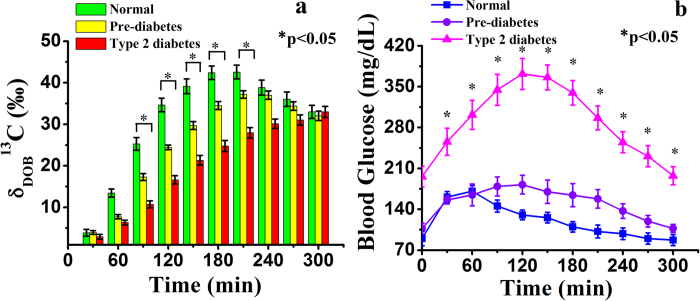
Figure 1. Kinetics study of breath carbon-13 isotope excretions and blood glucose levels after administration of 13C-glucose.
a, Breath δDOB13C (‰) enrichments. b, blood glucose concentrations for normal (NDC), pre-diabetes (PD) and Type 2 diabetes (T2D) individuals at every 30 min interval during 5 h-OGTT. *indicates statistically significant difference (p < 0.05). Data are expressed in terms of mean ± SEM.

