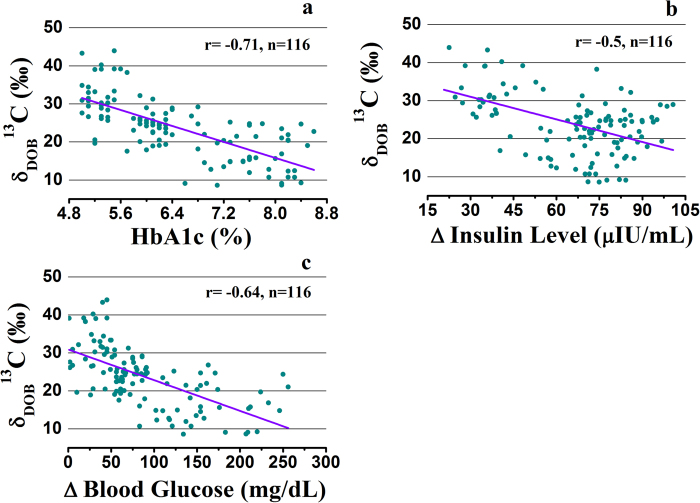
Figure 2. Linear regression plots to show the correlations of δDOB13C (‰) in breath with different invasive parameters.
a, breath δDOB13C(‰) with glycosylated haemoglobin (HbA1c %). b, plasma insulin levels (∆ Insulin Level) from the baseline during 2 h-OGTT. c, shows correlation of blood glucose concentrations (∆ Blood Glucose). The data are statistically significant different (p < 0.001).

