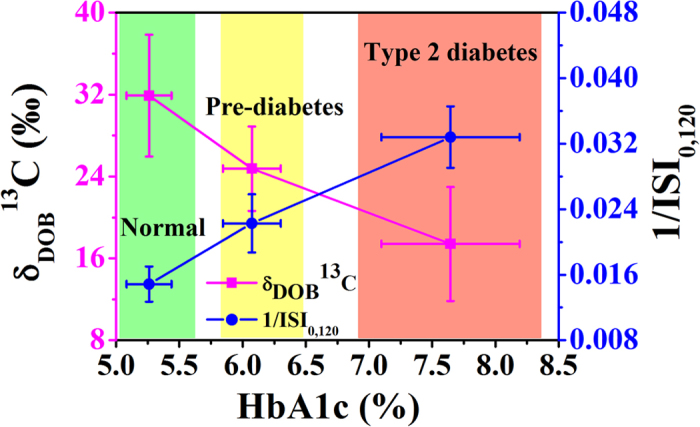
Figure 4. Distribution of δDOB13C‰ and 1/ISI0,120 values against HbA1c (%) in normal (NDC), pre-diabetes (PD) and type 2 diabetes (T2D).

Plot represents the clear transitions of δDOB13C and 1/ISI0,120 from NDC (green) to PD (yellow) and T2D (red). Data are expressed as mean ± SD.
