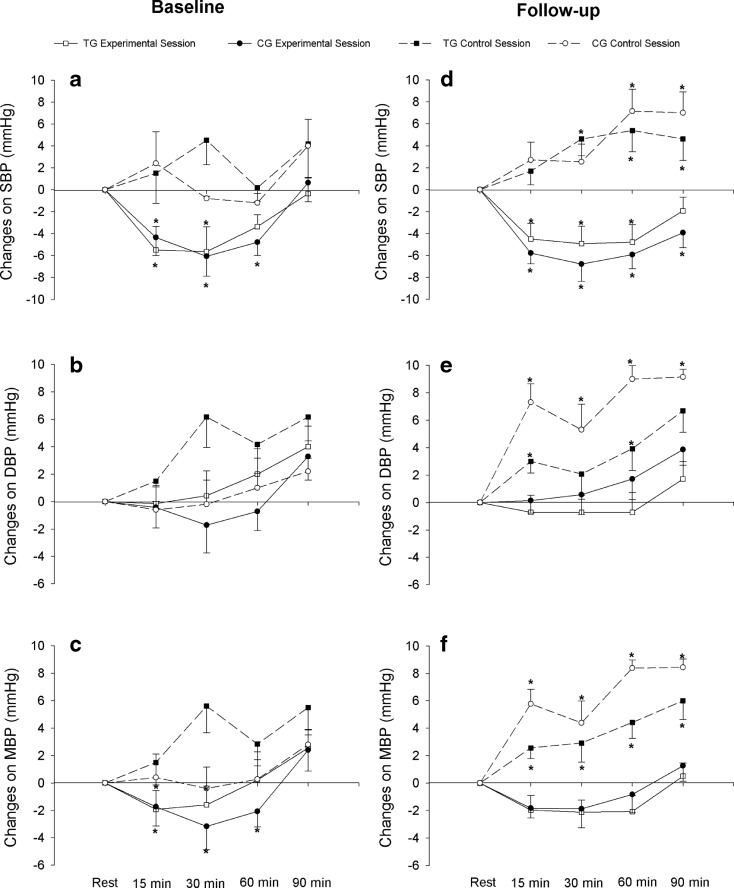
Fig. 2.
Systolic blood pressure (SBP), diastolic blood pressure (DBP), and mean blood pressure (MBP) for training group (TG = 14) and control group (CG = 14), in resistance exercise and control sessions at baseline (a, b, and c) and after 12 weeks of intervention - follow up - (d, e, and f). *P < 0.05 vs. rest

