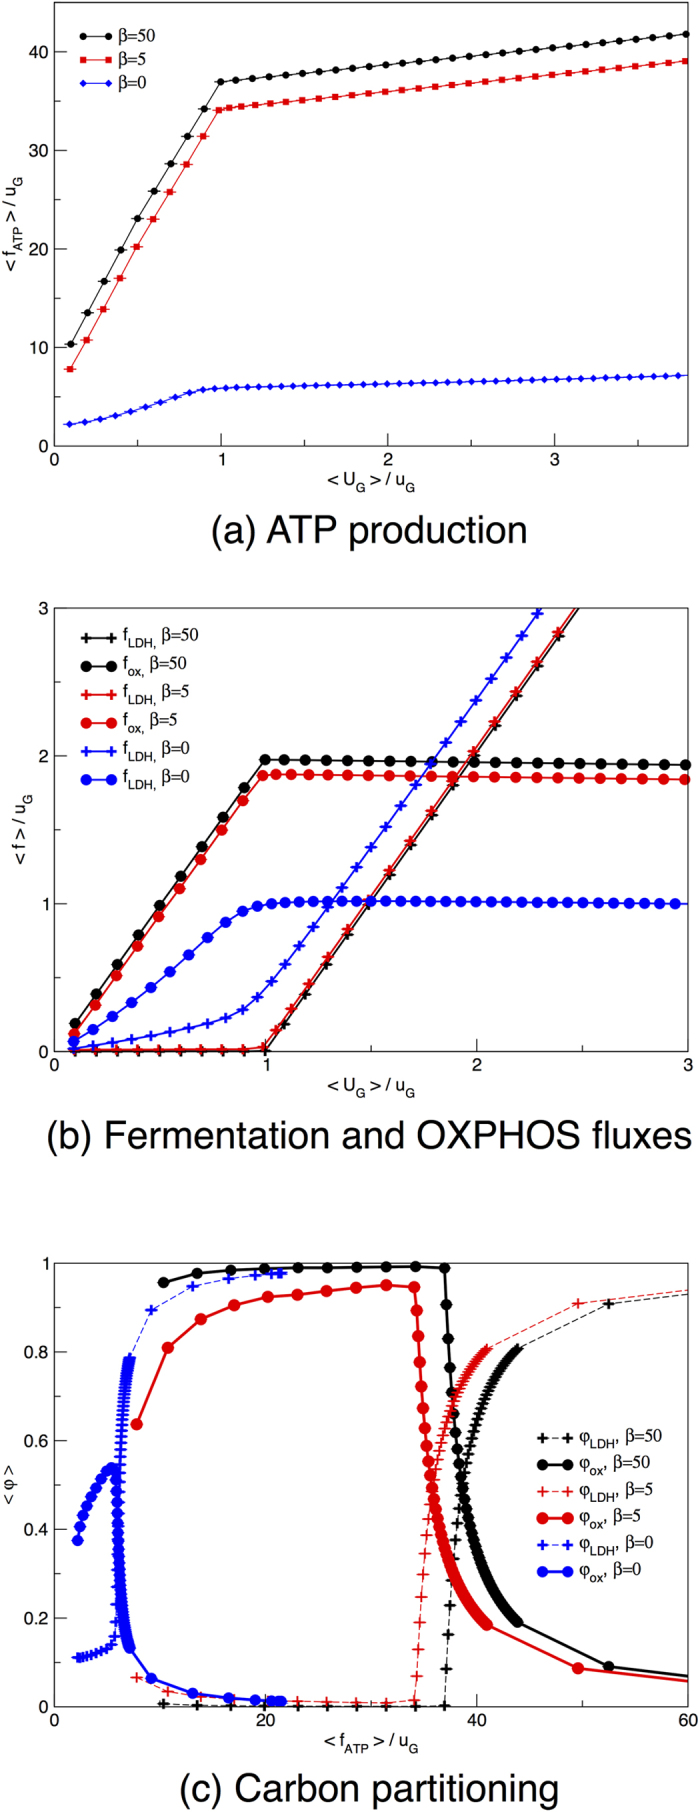
Figure 4. An isolated HCCN maximizes the ATP yield by directing glucose to OXPHOS even in absence of an active ATP maximization.

(a) Average ATP production as a function of the re-scaled average glucose supply. (b) Average flux through LDH (crosses) and PDHm (circles) as a function of the re-scaled average glucose supply. (c) Fraction of ATP produced via glycolysis (crosses) or via OXPHOS (circles) as a function of the re-scaled total ATP produced. The flux through each pathway is re-scaled by half the amount of glucose intaken by the cell (because with one molecule of glucose cells produce two molecules of pyruvate). Curves describe the behaviour of an ATP-maximizing HCCN (black lines, β = 50), a loosely maximizing donor (red lines, β = 5) or the result of a uniform sampling of the allowed flux states for a HCCN (blue lines, β = 0). Error bars for the s.e.m. are smaller than symbols.
