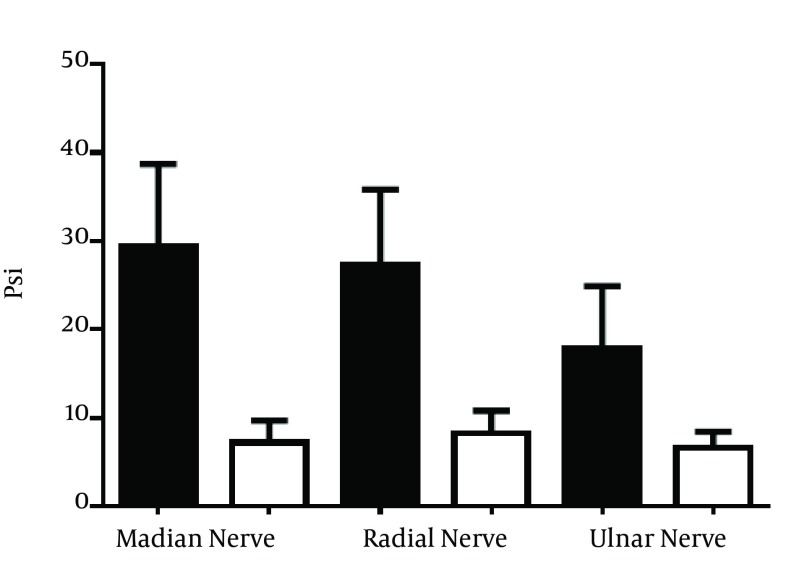
Figure 4. The Bar Graph Shows the Peak Intraneural and Extraneural Pressures of the Median, Radial, and Ulnar Nerves Following Injections of 1.0 mL Saline With a Flow Rate of 0.1 mL/sec using an 80-mm 22-G Needle.
The data are statistically significant across all three nerves; the P values are < 0.01 for all three nerves, ie. median, radial, and ulnar (a paired-samples t test was used; n = 10).

